- Analytics
- Technical Analysis
Exxon Stocks Technical Analysis - Exxon Stocks Trading: 2020-01-14
Exxon Mobil sells low-return assets
In this review, we suggest considering the personal composite instrument (PCI) XOM_Brent. It reflects the price dynamics of stocks of the US oil company Exxon Mobil Corporation against a physically delivered Brent crude oil futures contract. Will the XOM_Brent rise?
The growth of this PCI means that Exxon Mobil stock prices are rising faster than oil. In the last 9 months, they have strongly diverged in dynamics from the Dow Jones Industrial Average, which grew by 9.5%. At the same time, Exxon Mobil stocks fell by 13.5%. The main negative factor was the forecast of a decrease in operating results in the 4th quarter of 2019. To improve its financial performance, Exxon Mobil is going to sell low-return assets worth $25 billion by 2025. The funds will be used for capital investments in projects with higher profitability and payments to shareholders. Exxon Mobil's dividend yield is 5% per annum. Oil prices, in turn, are falling due to subsiding tensions in the Middle East and a decrease in demand for gas in the United States. According to the U.S. Energy Information Administration, gasoline inventories reached a 4-year high last week. In 2019, car sales fell by 1.4% in the US, and by 8.2% in China. This may become a global trend and negatively affect oil prices.
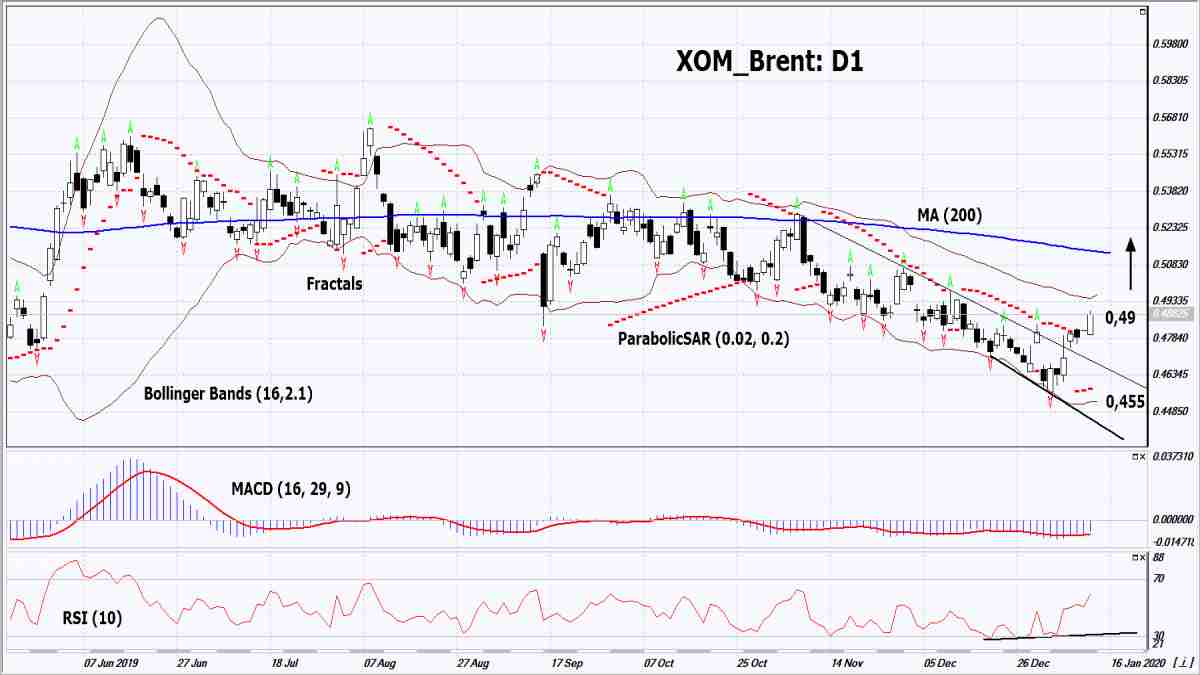
On the daily timeframe, the XOM_Brent: D1 overcame the resistance line of the downtrend. A number of technical analysis indicators formed buy signals. The further price increase is possible in case of the improvement of the financial performance of Exxon Mobil and stagnation in the global oil market.
- The Parabolic indicator gives a bullish signal.
- The Bollinger bands have widened, which indicates high volatility. Both Bollinger bands are titled up.
- The RSI indicator is above 50. It has formed a positive divergence.
- The MACD indicator gives a bullish signal.
The bullish momentum may develop in case XOM_Brent exceeds the last high at 0.49. This level may serve as an entry point. The initial stop loss may be placed below the last fractal low and the Parabolic signal at 0.455. After opening the pending order, we shall move the stop to the next fractal low following the Bollinger and Parabolic signals. Thus, we are changing the potential profit/loss to the breakeven point. More risk-averse traders may switch to the 4-hour chart after the trade and place there a stop loss moving it in the direction of the trade. If the price meets the stop level (0.455) without reaching the order (0.49), we recommend to close the position: the market sustains internal changes that were not taken into account.
Summary of technical analysis
| Position | Buy |
| Buy stop | Above 0.49 |
| Stop loss | Below 0.455 |
Explore our
Trading Conditions
- Spreads from 0.0 pip
- 30,000+ Trading Instruments
- Stop Out Level - Only 10%
Ready to Trade?
Open Account Note:
This overview has an informative and tutorial character and is published for free. All the data, included in the overview, are received from public sources, recognized as more or less reliable. Moreover, there is no guarantee that the indicated information is full and precise. Overviews are not updated. The whole information in each overview, including opinion, indicators, charts and anything else, is provided only for familiarization purposes and is not financial advice or а recommendation. The whole text and its any part, as well as the charts cannot be considered as an offer to make a deal with any asset. IFC Markets and its employees under any circumstances are not liable for any action taken by someone else during or after reading the overview.
