- Analytics
- Top Gainers / Losers
Top Gainers and Losers: Turkish Lira and South African Rand
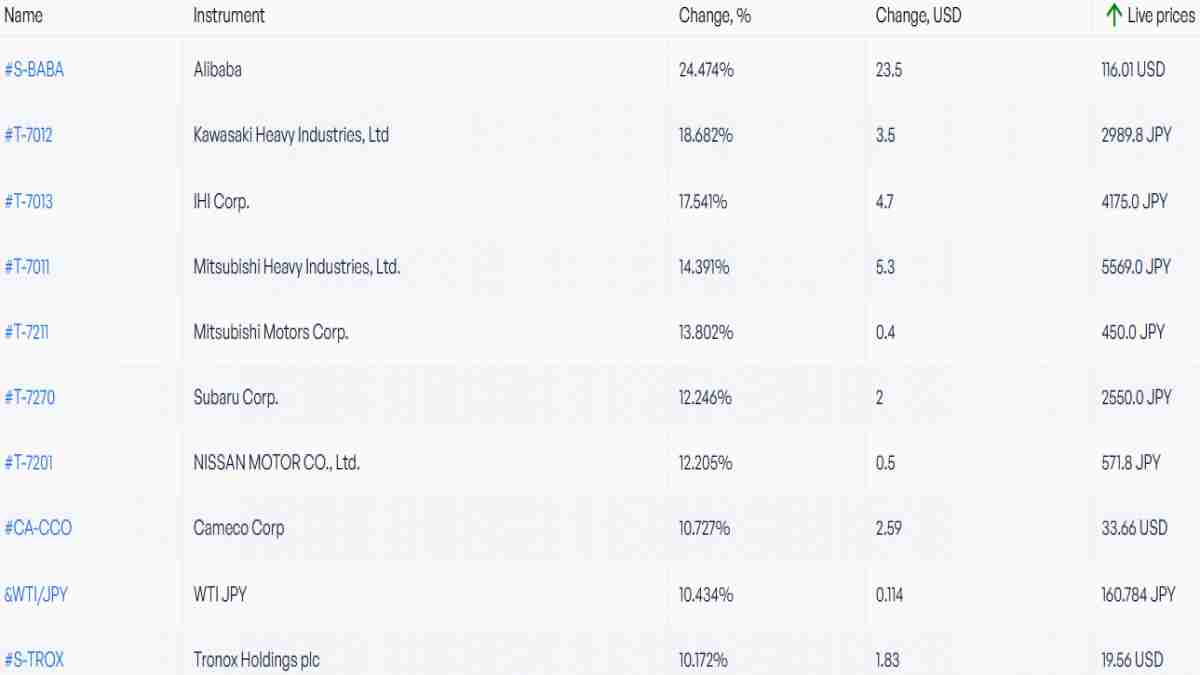
Top Gainers - global market
Over the past 7 days, the US dollar index has risen. Investors do not rule out a US Federal Reserve rate hike of 0.5% to 1.5% at the June 15 meeting. US 10-year Treasury trades with yields above 3% per annum. The Australian dollar strengthened as the Reserve Bank of Australia hiked its rate to 0.85% from 0.35%. Its growth at once by 0.5% was the first time in the last 20 years. The Canadian dollar and the Russian ruble strengthened against the backdrop of rising oil prices. The South African rand strengthened on strong Q1 2022 GDP data for South Africa (+1.9% q/q). The Japanese yen continued to weaken on the back of Bank of Japan (BoJ) Governor Haruhiko Kuroda's statement that a weak yen could have a positive impact on the Japanese economy. Japan Gross Domestic Product in Q1 2022 (-0.5% y/y) was better than expected (-1% y/y). This may help keep the BoJ loose monetary policy. The Turkish lira continued to weaken as the Central Bank of the Republic of Turkey maintains its rate at 14% despite inflation rising to 73.5% y/y in May.
1. Alibaba Group, +24,5% – Chinese online store Alibaba.com
2. Kawasaki Heavy Industries, Ltd, +18,7% – Japanese company for the production of various industrial equipment and vehicles
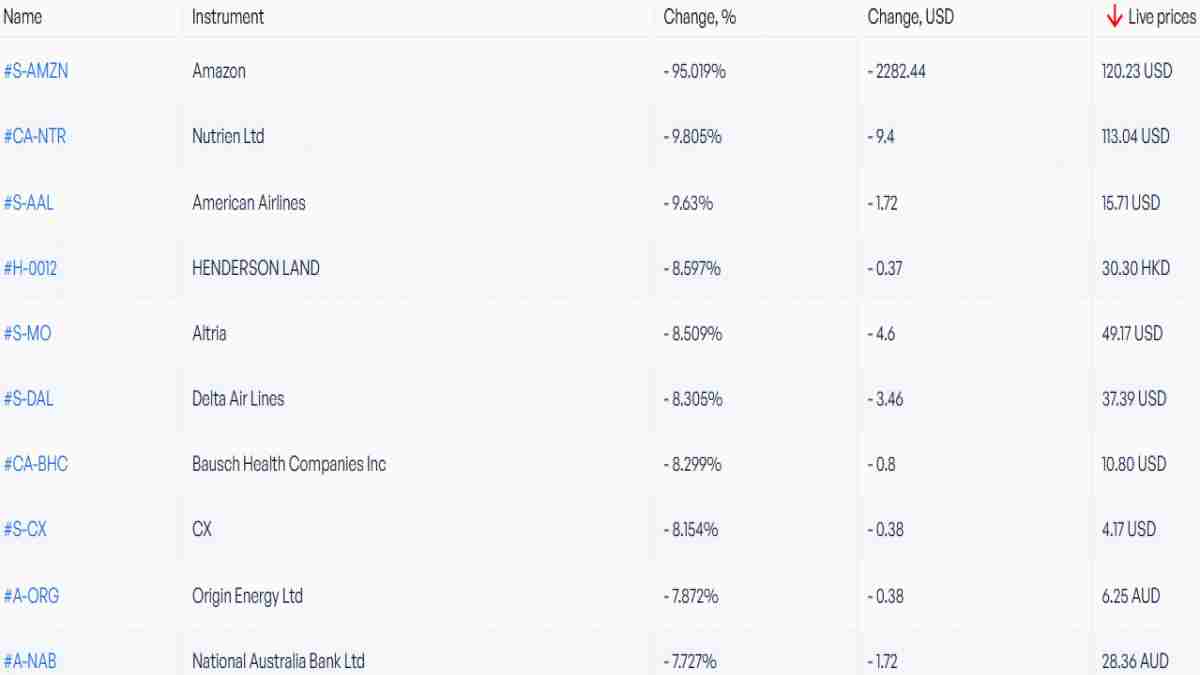
Top Losers - global market
1. Amazon.com Inc – American online store.
2. Nutrien Ltd – Canadian fertilizer manufacturer.
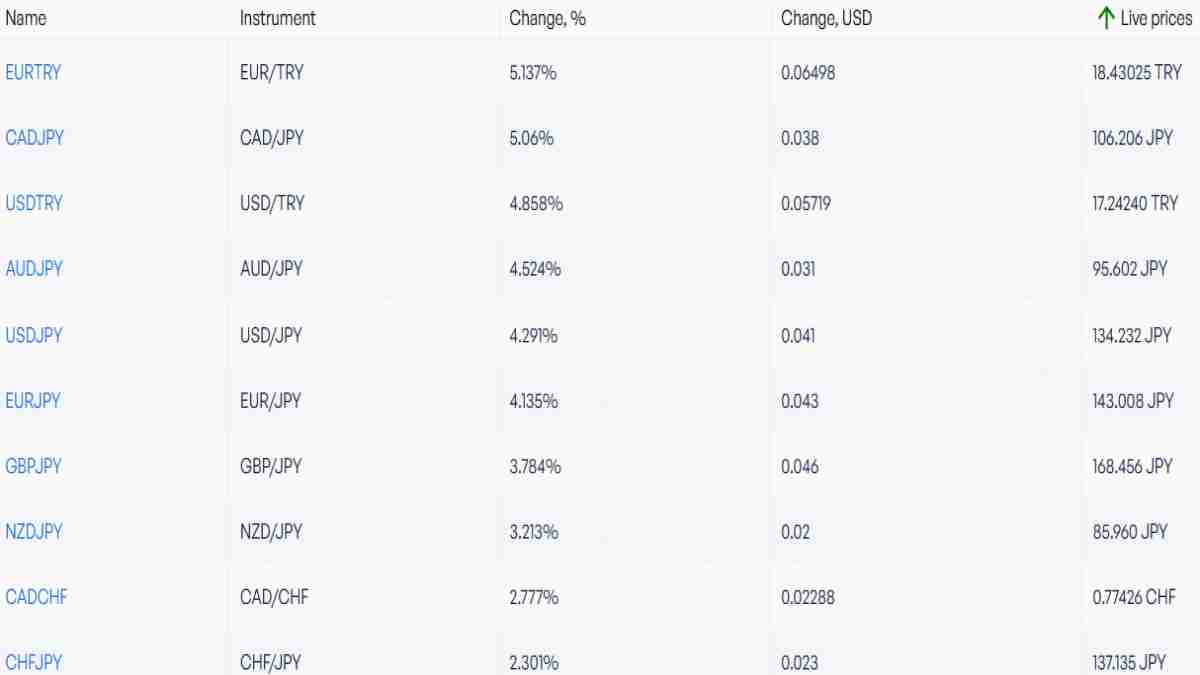
Top Gainers - foreign exchange market (Forex)
1. EURTRY, USDTRY - the growth of these charts means the strengthening of the euro and the us dollar against the Turkish lira.
2. CADJPY, AUDJPY - the growth of these charts means the weakening of the Japanese yen against the Canadian and Australian dollars.
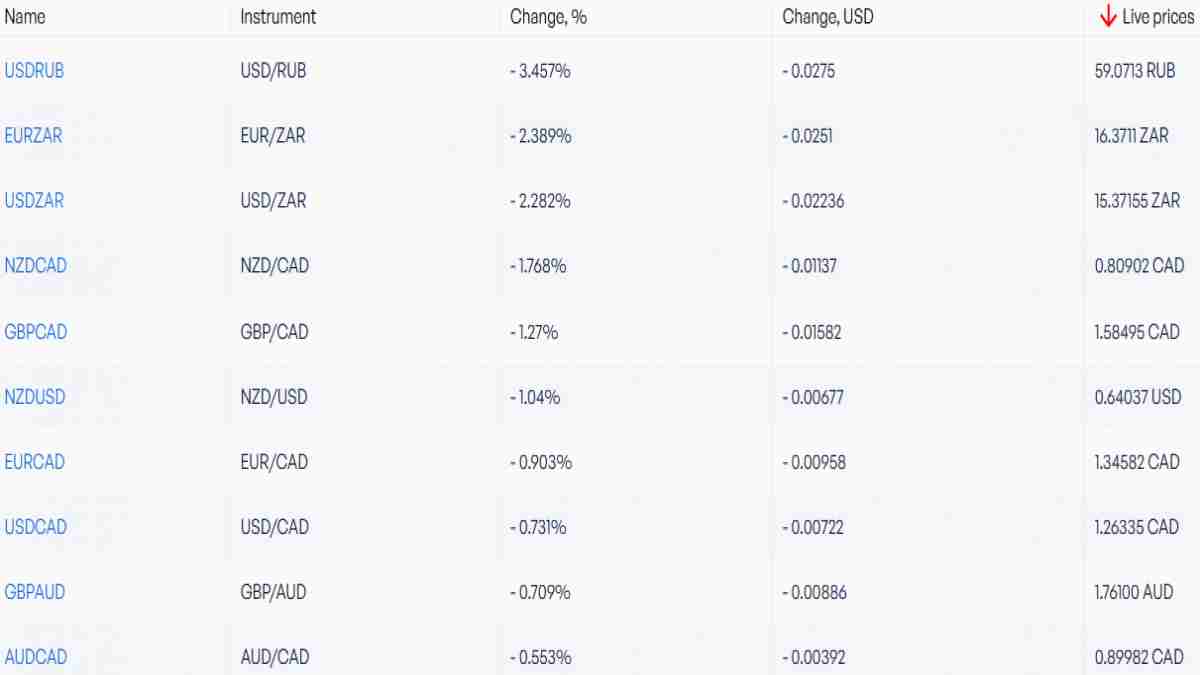
Top Losers - foreign exchange market (Forex)
1. USDRUB, NZDCAD -the fall of these charts means the weakening of the US dollar against the Russian ruble and the New Zealand dollar against the Canadian dollar.
2. EURZAR, USDZAR - the fall of these charts means the strengthening of the South African rand against the euro and the US dollar.
New Exclusive Analytical Tool
Any date range - from 1 day to 1 year
Any Trading Group - Forex, Stocks, Indices, etc.
Note:
This overview has an informative and tutorial character and is published for free. All the data, included in the overview, are received from public sources, recognized as more or less reliable. Moreover, there is no guarantee that the indicated information is full and precise. Overviews are not updated. The whole information in each overview, including opinion, indicators, charts and anything else, is provided only for familiarization purposes and is not financial advice or а recommendation. The whole text and its any part, as well as the charts cannot be considered as an offer to make a deal with any asset. IFC Markets and its employees under any circumstances are not liable for any action taken by someone else during or after reading the overview.
- Get Certificate


Previous Top Gainers & Losers
Over the past 7 days, the American dollar has remained almost unchanged. According to the CME FedWatch tool, there is an 89% probability of the U.S. Federal Reserve raising interest rates at the meeting on July 26th. The Swiss franc has strengthened due to positive economic indicators such as Credit...
Over the past 7 days, the US dollar index has declined. As expected, the Federal Reserve (Fed) maintained its interest rate at 5.25% during the meeting on June 14. Now, investors are monitoring economic statistics and trying to forecast the change in the Fed's rate at the next meeting on July 26. The...
Over the past 7 days, the US dollar index has remained largely unchanged. It has been trading in a narrow range of 103.2-104.4 points for the 4th week in a row. Investors are awaiting the outcome of the Federal Reserve meeting on June 14. Tesla shares have risen due to the opening of new gigafactories...