- Analytics
- Technical Analysis
Nippon Yusen Kabushiki Kaisha Technical Analysis - Nippon Yusen Kabushiki Kaisha Trading: 2015-11-12
Stagnation of maritime shipping or cheap fuel?
The stocks of the Japanese maritime shipping company Nippon Yusen Kabushiki Kaisha (NYK Line) edged up slightly after the R&I agency rated it A- stable. The Moody's subdivision in Japan expects the maritime shipments industry to stabilize forecasting the volumes will increase by 2% within 12-18 months and the gross operating earnings by 5-10% due to the low fuel prices. Will the NYK Line stocks rise?
Late October the company revised down its performance outlook for the fiscal year ending in March 2016 but the news did not have a negative impact on its stocks prices. The half year performance of NYK Line (March-September this year) was likely to have a stronger positive impact on the market. Its revenue increased by scarce 1.6% while the fallen fuel prices pushed its operating revenue up by 38.5% and threefold the EPS. Even after the full-year forecasts were revised down, the company expects its operating profit to increase by 13.3% which is above the upper boundary of the Moody's estimate for the maritime shipping industry. NYK Line is planning to pay out the dividends of 3 yen per share. The record day is scheduled on March 29, 2016. Since the start of the year, the company’s stocks have lost 3.8% while the Japanese Nikkei index climbed 12.9% up.
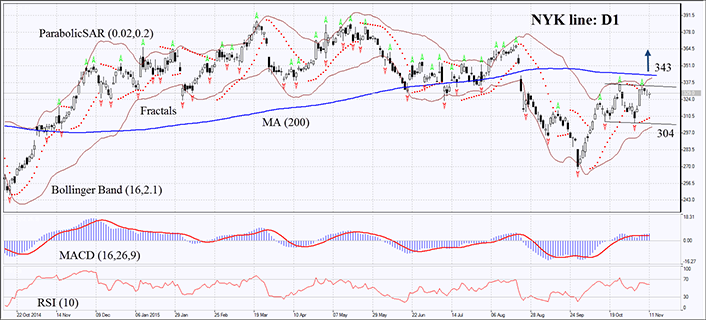
On the daily chart the T-9101: D1 is within the neutral trend below its 200-day moving average. The Parabolic and MACD indicators have formed the buy signals. RSI is neutral and above 50. It has not yet reached the overbought zone, no divergence on the chart. The Bollinger bands have contracted which may mean reduced volatility and are tilted upwards. The bullish momentum may develop in case the NYK Line stocks surpass two fractal highs, the upper line of the neutral trend and the 200-day moving average at 343. This level may serve the point of entry. The initial risk-limit may be placed below the last fractal low at 304. Having opened the pending order we shall move the stop to the next fractal low following the Parabolic and Bollinger signals. Thus, we are changing the probable profit/loss ratio to the breakeven point. The most risk-averse traders may switch to the 4-hour chart after the trade and place there a stop-loss moving it in the direction of the trade. If the price meets the stop-loss level at 304 without reaching the order at 343, we recommend cancelling the position: the market sustains internal changes which were not taken into account.
| Position | Buy |
| Buy stop | above 343 |
| Stop loss | below 304 |
Explore our
Trading Conditions
- Spreads from 0.0 pip
- 30,000+ Trading Instruments
- Instant Execution
Ready to Trade?
Open Account Note:
This overview has an informative and tutorial character and is published for free. All the data, included in the overview, are received from public sources, recognized as more or less reliable. Moreover, there is no guarantee that the indicated information is full and precise. Overviews are not updated. The whole information in each overview, including opinion, indicators, charts and anything else, is provided only for familiarization purposes and is not financial advice or а recommendation. The whole text and its any part, as well as the charts cannot be considered as an offer to make a deal with any asset. IFC Markets and its employees under any circumstances are not liable for any action taken by someone else during or after reading the overview.
