- Analytics
- Technical Analysis
Platinum Technical Analysis - Platinum Trading: 2018-07-24
Low prices reduce profitability of mining
Platinum prices fell by almost 20% from their January highs and for the first time in 10 years fell below $800 per ounce. Low prices can make unprofitable the mining of this metal. Is there a possibility for platinum prices to correct up?
70% of platinum is mined in South Africa. A number of local manufacturers claim that mining is unprofitable at current low prices. The main reason for the price decrease was the reduction in cars with diesel engines after the scandal with the German company Volkswagen, which was accused by the US authorities of distortion of environmental indicators. In addition, the overall decrease in the value of precious metals had a negative impact. The GFMS agency forecasts an increase in the world deficit of platinum in the current year for the fifth consecutive year - up to 280 thousand ounces from 53 thousand ounces last year. Amid low prices, world production of platinum may decline by more than 3%. Note that currently 1 ounce of gold costs nearly 1.4 ounces of platinum. This is the maximum ratio for the entire recent history (from the mid-1980s of the last century).
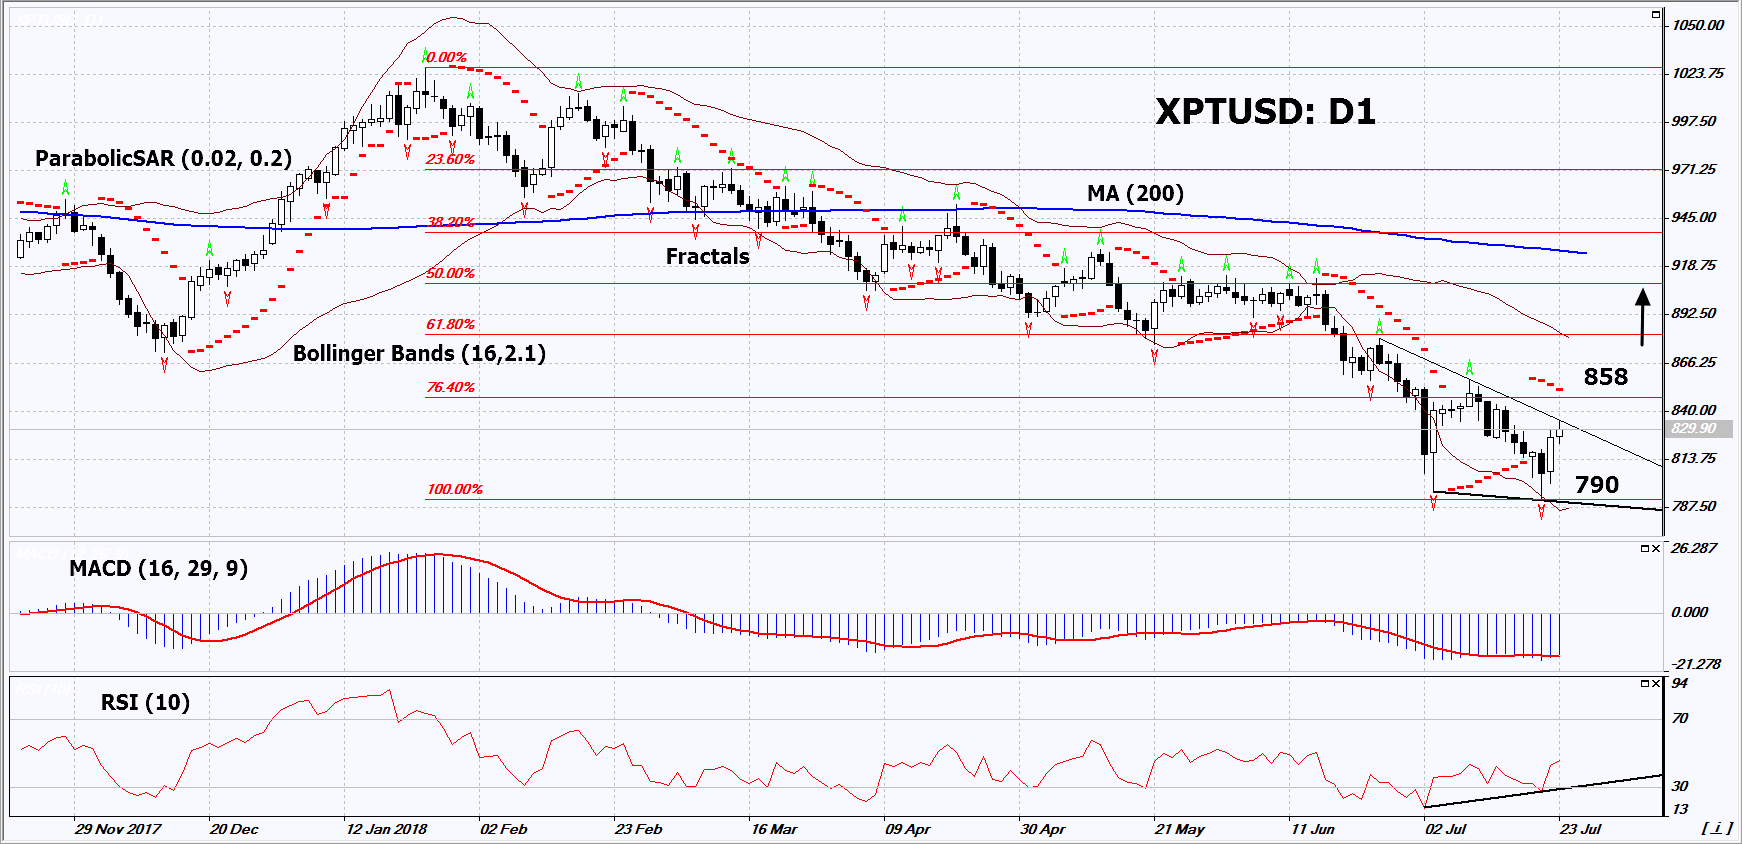
On the daily timeframe, XPTUSD: D1 updated the 10-year low and is trying to correct up. A number of technical analysis indicators formed buy signals. The further price increase is possible in case of a decrease in global production and the resumption of demand for diesel cars.
- The Parabolic indicator gives a bearish signal. It can be used as an additional level of resistance, which must be overcome before opening a buy position.
- The Bollinger bands have widened, which indicates high volatility. The lower band is titled upward.
- The RSI indicator is below 50. It has formed a positive divergence.
- The MACD indicator gives a bullish signal.
The bullish momentum may develop in case XPTUSD exceeds its last fractal high and the Parabolic signal at 858. This level may serve as an entry point. The initial stop loss may be placed below the last fractal low, the 10-year low and the lower Bollinger band at 790. After opening the pending order, we shall move the stop to the next fractal low following the Bollinger and Parabolic signals. Thus, we are changing the potential profit/loss to the breakeven point. More risk-averse traders may switch to the 4-hour chart after the trade and place there a stop loss moving it in the direction of the trade. If the price meets the stop level (790) without reaching the order (858), we recommend to close the position: the market sustains internal changes that were not taken into account.
Summary of technical analysis
| Position | Buy |
| Buy stop | Above 858 |
| Stop loss | Below 790 |
Explore our
Trading Conditions
- Spreads from 0.0 pip
- 30,000+ Trading Instruments
- Instant Execution
Ready to Trade?
Open Account Note:
This overview has an informative and tutorial character and is published for free. All the data, included in the overview, are received from public sources, recognized as more or less reliable. Moreover, there is no guarantee that the indicated information is full and precise. Overviews are not updated. The whole information in each overview, including opinion, indicators, charts and anything else, is provided only for familiarization purposes and is not financial advice or а recommendation. The whole text and its any part, as well as the charts cannot be considered as an offer to make a deal with any asset. IFC Markets and its employees under any circumstances are not liable for any action taken by someone else during or after reading the overview.
