- एनालिटिक्स
- टेक्निकल एनालिसिस
AUD/USD तकनीकी विश्लेषण - AUD/USD ट्रेडिंग: 2025-06-25
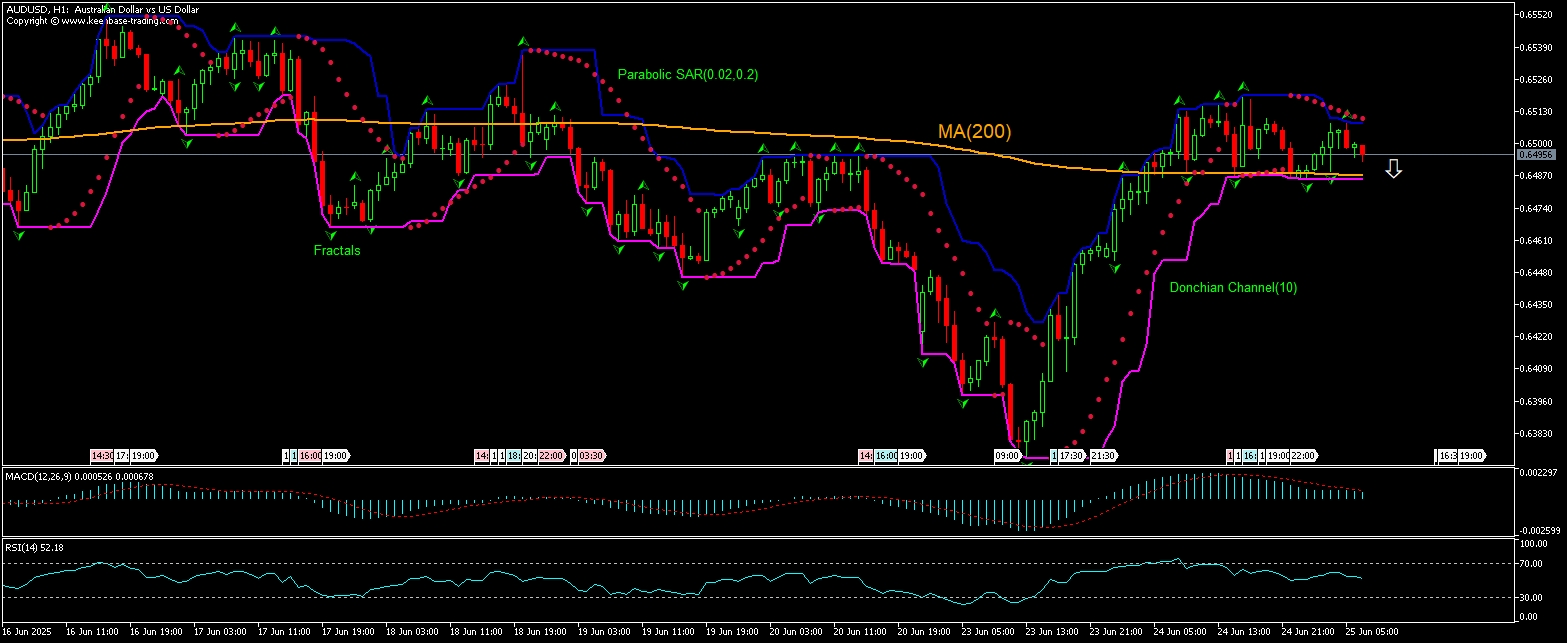
AUD/USD तकनीकी विश्लेषण सारांश
उपरोक्त 0.64855
Buy Stop
से नीचे 0.65101
Stop Loss
| संकेतक | संकेत |
| RSI | तटस्थ |
| MACD | बेचना |
| Donchian Channel | तटस्थ |
| MA(200) | खरीदें |
| Fractals | तटस्थ |
| Parabolic SAR | बेचना |
AUD/USD चार्ट विश्लेषण
AUD/USD तकनीकी विश्लेषण
The technical analysis of the AUDUSD price chart on 1-hour timeframe shows AUDUSD,H1 is moving to test the 200-period moving average MA(200) after rebounding to one-week high yesterday. We believe the bearish momentum will continue after the price breaches below the lower bound of the Donchian channel at 0.64855. A level below this can be used as an entry point for placing a pending order to sell. The stop loss can be placed above 0.65101. After placing the order, the stop loss is to be moved to the next fractal high indicator, following Parabolic signals. Thus, we are changing the expected profit/loss ratio to the breakeven point. If the price meets the stop loss level without reaching the order, we recommend cancelling the order: the market has undergone internal changes which were not taken into account.
मौलिक विश्लेषण FOREX - AUD/USD
Australia’s inflation remained slowed in May. Will the AUDUSD price decline?
Australian Bureau of Statistics reported the Consumer Price Index (CPI) slowed to 2.1% over year in May, down from the previous month’s 2.4% when a decline to 2.3% was expected. The reading remained the lowest inflation rate since last October. The acceleration of consumer prices inflation for alcohol and tobacco and clothing didn’t offset slowing of inflation for food and non-alcoholic beverages and housing and slowing deflation in transport sector. Core inflation also eased to 2.4% from 2.8%, supporting the views of a near-term rate cut by the Reserve Bank of Australia at its meeting in July. Expectations of a rate cut by the RBA is bearish for Australian dollar and AUDUSD currency pair.
Explore our
Trading Conditions
- Spreads from 0.0 pip
- 30,000+ Trading Instruments
- Instant Execution
Ready to Trade?
Open Account ध्यान दें:
यह ओवरव्यू एक जानकारीपूर्ण और ट्यूटोरियल चरित्र है और मुफ्त में प्रकाशित किया जाता है. सभी डेटा, ओवरव्यू में शामिल, सार्वजनिक स्रोतों से प्राप्त कर रहे हैं, कम या ज्यादा विश्वसनीय रूप में मान्यता प्राप्त. अतिरिक्त, संकेत दिया जानकारी पूर्ण और सटीक है कि कोई गारंटी नहीं है. ओवरव्यू अद्यतन नहीं हैं . प्रत्येक ओवरव्यू में पूरी जानकारी, भी शामिल राय, इंडीकेटर्स , चार्ट और कुछ और, परिचय उद्देश्यों के लिए ही प्रदान की जाती है और वित्तीय सलाह या सिफारिश नहीं है. पूरे पाठ और उसके किसी भी हिस्से, और साथ हीचार्ट किसी भी संपत्ति के साथ एक सौदा करने के लिए एक प्रस्ताव के रूप में नहीं माना जा सकता है . IFC मार्केट्स और किसी भी परिस्थिति में अपने कर्मचारियों को किसी और के द्वारा की गई किसी कार्रवाई के दौरान लिए उत्तरदायी नहीं हैं या ओवरव्यू पढ़ने के बाद.

