- एनालिटिक्स
- मार्किट डेटा
- स्टॉक CFDs परिसस
- PepsiCo स्टॉक प्राइस टुडे
PepsiCo स्टॉक चार्ट & डाटा - PEP
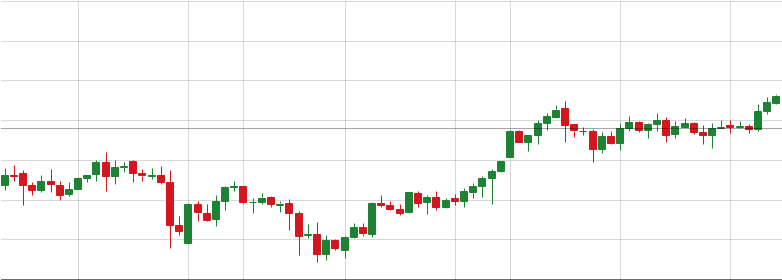
This page includes full information about the PepsiCo, including the PepsiCo live chart and dynamics on the chart by choosing any of 8 available time frames.
By moving the start and end of the timeframe in the bottom panel you can see both the current and the historical price movements of the instrument. In addition, you have an opportunity to choose the type of display of the PepsiCo live chart – Candles or Lines chart – through the buttons in the upper left corner of the chart. All clients that have not yet decided which instrument to trade are in the right place since reading the full characteristics of the PEP and watching its performance on the charts will help them to make their final decision.
PepsiCo स्टॉक प्राइस टुडे
- 1m
- 5m
- 15m
- 30m
- 1h
- 4h
- 1d
- 1w
The Price of PepsiCo is Rising This Week
PepsiCo is currently trading at 135.68, up 2.26% since yesterday. Looking at broader trends, it's shifted 1.53% this week and 1.15% over the last 30 days.
| अवधि या दिनांक सीमा का चयन करें | ओपन प्राइस | चेंज % |
|---|---|---|
| दैनिक | 137.96 | 2.26% |
| साप्ताहिक | 134.432 | 1.53% |
| माह | 128.89714 | 1.15% |
तकनीकी विश्लेषण
तकनीकी विश्लेषण मूल्य इतिहास के आधार पर बाजार की गतिशीलता के अध्ययन और मूल्यांकन की एक विधि है। इसका मुख्य उद्देश्य तकनीकी विश्लेषण उपकरणों के माध्यम से भविष्य में एक वित्तीय साधन की कीमत गतिशीलता का पूर्वानुमान देना है। तकनीकी विश्लेषक विभिन्न मुद्राओं और मुद्रा जोड़े की कीमतों की भविष्यवाणी के लिए बाजार विश्लेषण की इस पद्धति का उपयोग करते हैं। इस प्रकार के विश्लेषण से आप व्यापारिक साधनों के ऐतिहासिक मूल्यों के अध्ययन के आधार पर बाजार का अनुमान लगा सकते हैं.
कीमत गतिशीलता के नवीनतम तकनीकी विश्लेषण भी देखें PEP: PEP पूर्वानुमान