- एनालिटिक्स
- टेक्निकल एनालिसिस
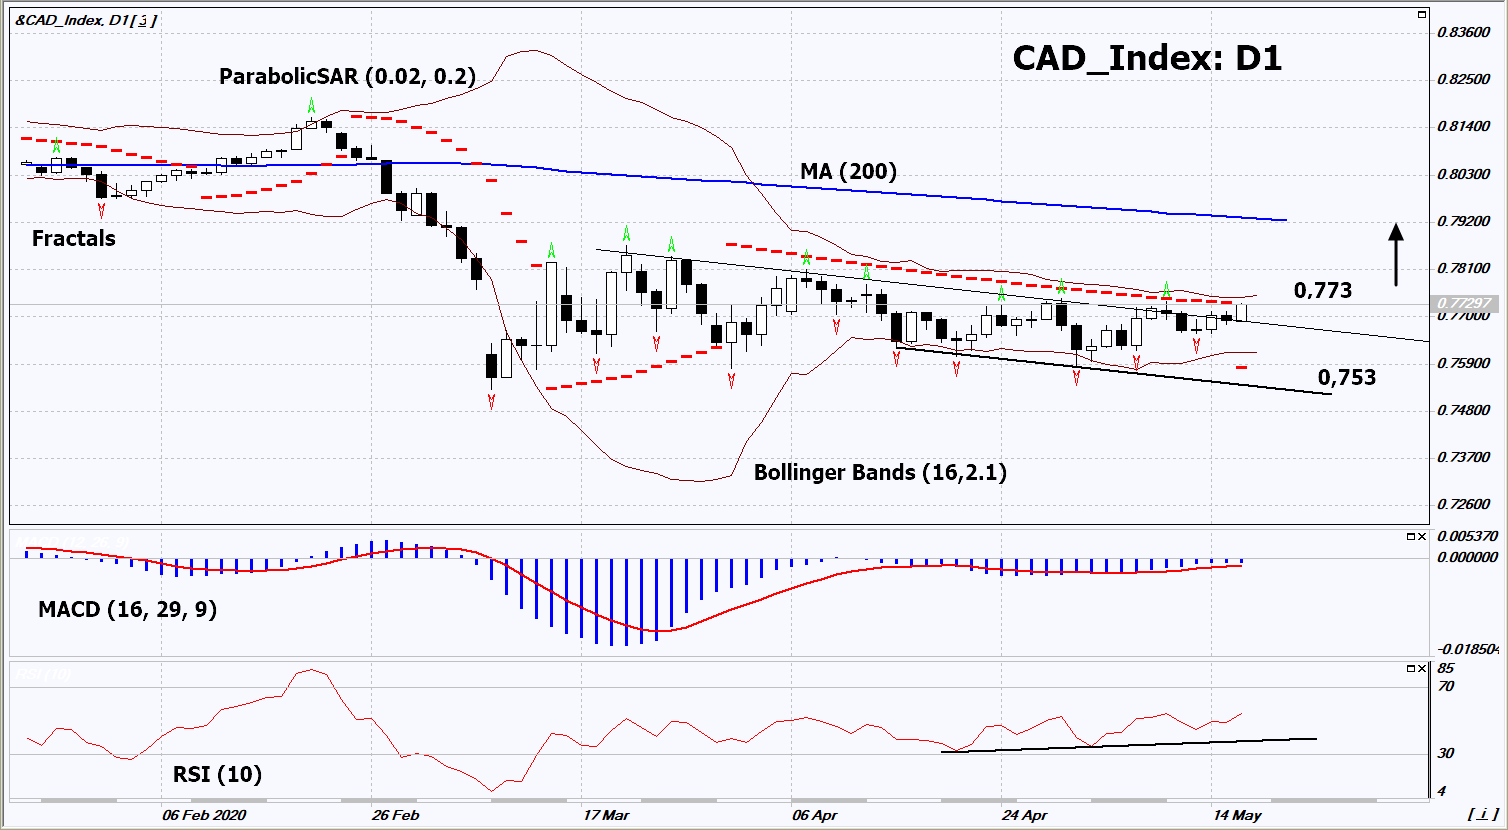
CAD करेंसी इंडेक्स तकनीकी विश्लेषण - CAD करेंसी इंडेक्स ट्रेडिंग: 2020-05-19
CAD करेंसी इंडेक्स तकनीकी विश्लेषण सारांश
उपरोक्त 0,773
Buy Stop
से नीचे 0,753
Stop Loss
| संकेतक | संकेत |
| RSI | खरीदें |
| MACD | खरीदें |
| MA(200) | तटस्थ |
| Fractals | तटस्थ |
| Parabolic SAR | खरीदें |
| Bollinger Bands | खरीदें |
CAD करेंसी इंडेक्स चार्ट विश्लेषण
CAD करेंसी इंडेक्स तकनीकी विश्लेषण
On the daily timeframe, CAD_Index: D1 broke through the upper border of the downtrend. A number of indicators of technical analysis formed signals for a further increase. We do not exclude a bullish movement if CAD_Index rises above its last upper fractal and Bollinger Upper Line: 0.773. This level can be used as an entry point. We can set a stop loss below the Parabolic signal, the lower Bollinger line and the lowest since 2016: 0.753. After opening the pending order, we move the stop loss after the Bollinger and Parabolic signals to the next fractal minimum. Thus, we change the potential profit / loss ratio in our favor. After the transaction, the most risk-averse traders can switch to a four-hour chart and set a stop loss, moving it in the direction of the trend. If the price meets the stop loss level (0.753) without reaching the order (0.773), it is recommended to delete the order: some internal changes in the market have not been taken into account.
मौलिक विश्लेषण PCI - CAD करेंसी इंडेक्स
In this review, we propose to consider a personal composite instrument (PCI) "CAD currency index." This is the Canadian dollar currency index, which rises with the strengthening of the Canadian currency. Is the growth of &CAD_Index quotes possible?
The share of energy products in Canada's exports reaches 30%. They include oil and petroleum products, natural gas and coal. The cost of energy products is correlated with oil quotes. As a rule, the Canadian dollar strengthens with rising hydrocarbons prices. West Texas Intermediate (WTI) oil is getting more expensive for the 5th day in a row and has already surpassed the psychological level of $ 30 per barrel. Investors believe that as quarantine is lifted in all countries of the world, fuel demand will recover. In particular, the demand for oil in China approached the “pre-quarantine” level. Citibank raised its forecast for WTI to $ 42 per barrel by the end of the year. On Monday, the United States announced successful trials of the vaccine against Covid-19, which contributed to a strong increase in oil prices. Inflation data will be released in Canada on Wednesday, and retail sales on Friday.
Explore our
Trading Conditions
- Spreads from 0.0 pip
- 30,000+ Trading Instruments
- Stop Out Level - Only 10%
Ready to Trade?
Open Account ध्यान दें:
यह ओवरव्यू एक जानकारीपूर्ण और ट्यूटोरियल चरित्र है और मुफ्त में प्रकाशित किया जाता है. सभी डेटा, ओवरव्यू में शामिल, सार्वजनिक स्रोतों से प्राप्त कर रहे हैं, कम या ज्यादा विश्वसनीय रूप में मान्यता प्राप्त. अतिरिक्त, संकेत दिया जानकारी पूर्ण और सटीक है कि कोई गारंटी नहीं है. ओवरव्यू अद्यतन नहीं हैं . प्रत्येक ओवरव्यू में पूरी जानकारी, भी शामिल राय, इंडीकेटर्स , चार्ट और कुछ और, परिचय उद्देश्यों के लिए ही प्रदान की जाती है और वित्तीय सलाह या सिफारिश नहीं है. पूरे पाठ और उसके किसी भी हिस्से, और साथ हीचार्ट किसी भी संपत्ति के साथ एक सौदा करने के लिए एक प्रस्ताव के रूप में नहीं माना जा सकता है . IFC मार्केट्स और किसी भी परिस्थिति में अपने कर्मचारियों को किसी और के द्वारा की गई किसी कार्रवाई के दौरान लिए उत्तरदायी नहीं हैं या ओवरव्यू पढ़ने के बाद.

