- एनालिटिक्स
- टेक्निकल एनालिसिस
तांबे तकनीकी विश्लेषण - तांबे ट्रेडिंग: 2020-12-10
तांबे तकनीकी विश्लेषण सारांश
उपरोक्त 3.5404
Buy Stop
से नीचे 3.3570
Stop Loss
| संकेतक | संकेत |
| RSI | तटस्थ |
| MACD | बेचना |
| Donchian Channel | खरीदें |
| MA(200) | खरीदें |
| Fractals | खरीदें |
| Parabolic SAR | बेचना |
तांबे चार्ट विश्लेषण
तांबे तकनीकी विश्लेषण
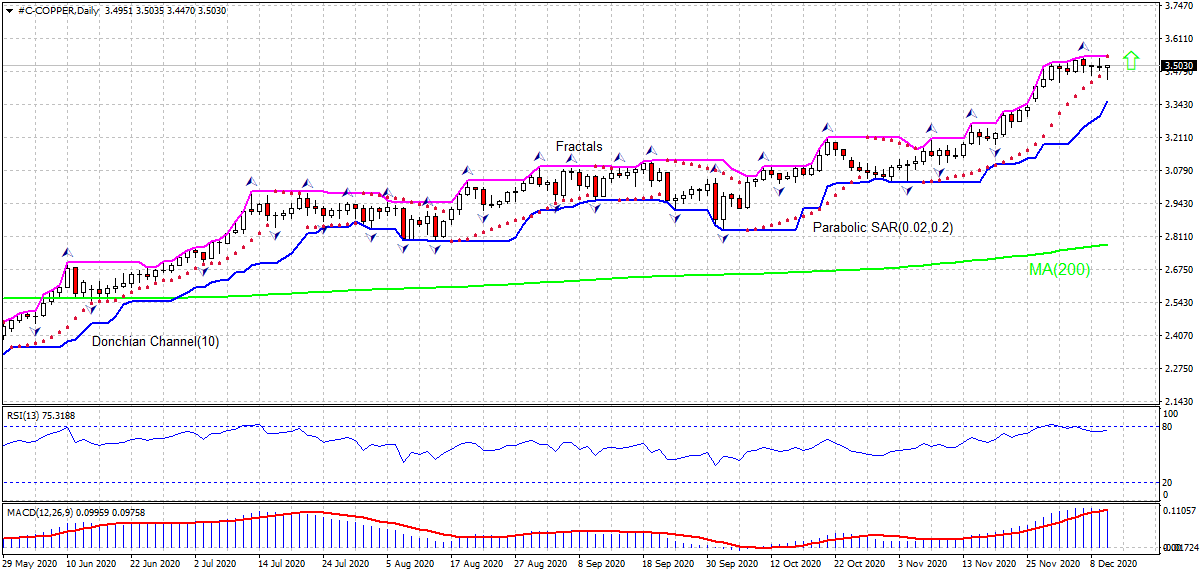
The COPPER technical analysis of the price chart in daily timeframe shows #C-COPPER: Daily is retracing down toward the 200-day moving average MA(200) after hitting seven year high on Monday. We believe the bullish momentum will continue as the price breaches above the upper Donchian boundary at 3.5404. A pending order to buy can be placed above that level. The stop loss can be placed below 3.3570. After placing the order, the stop loss is to be moved every day to the next fractal low indicator, following Parabolic signals. Thus, we are changing the expected profit/loss ratio to the breakeven point. If the price meets the stop loss level without reaching the order, we recommend cancelling the order: the market has undergone internal changes which were not taken into account.
मौलिक विश्लेषण कमोडिटीज - तांबे
China’s copper imports are up compared with the previous year levels. Will the copper price advance continue?
China’s November imports of unwrought copper were up 16.2% from 483,000 in November last year, according to customs data. And for the first 11 months of 2020 imports were 6.17 million tons, up 38.7% from the same period last year. China is the world’s biggest consumer of copper, and high Chinese imports is bullish for copper. At the same time Chinese imports have slowed in monthly terms: unwrought copper imports were 561,311 tons, down 9.2% from October’s 618,108, second consecutive monthly decline. Slowing of Chinese demand is a downside risk for copper.
Explore our
Trading Conditions
- Spreads from 0.0 pip
- 30,000+ Trading Instruments
- Stop Out Level - Only 10%
Ready to Trade?
Open Account ध्यान दें:
यह ओवरव्यू एक जानकारीपूर्ण और ट्यूटोरियल चरित्र है और मुफ्त में प्रकाशित किया जाता है. सभी डेटा, ओवरव्यू में शामिल, सार्वजनिक स्रोतों से प्राप्त कर रहे हैं, कम या ज्यादा विश्वसनीय रूप में मान्यता प्राप्त. अतिरिक्त, संकेत दिया जानकारी पूर्ण और सटीक है कि कोई गारंटी नहीं है. ओवरव्यू अद्यतन नहीं हैं . प्रत्येक ओवरव्यू में पूरी जानकारी, भी शामिल राय, इंडीकेटर्स , चार्ट और कुछ और, परिचय उद्देश्यों के लिए ही प्रदान की जाती है और वित्तीय सलाह या सिफारिश नहीं है. पूरे पाठ और उसके किसी भी हिस्से, और साथ हीचार्ट किसी भी संपत्ति के साथ एक सौदा करने के लिए एक प्रस्ताव के रूप में नहीं माना जा सकता है . IFC मार्केट्स और किसी भी परिस्थिति में अपने कर्मचारियों को किसी और के द्वारा की गई किसी कार्रवाई के दौरान लिए उत्तरदायी नहीं हैं या ओवरव्यू पढ़ने के बाद.

