- एनालिटिक्स
- टेक्निकल एनालिसिस
फीडर पशु तकनीकी विश्लेषण - फीडर पशु ट्रेडिंग: 2020-08-25
फीडर पशु तकनीकी विश्लेषण सारांश
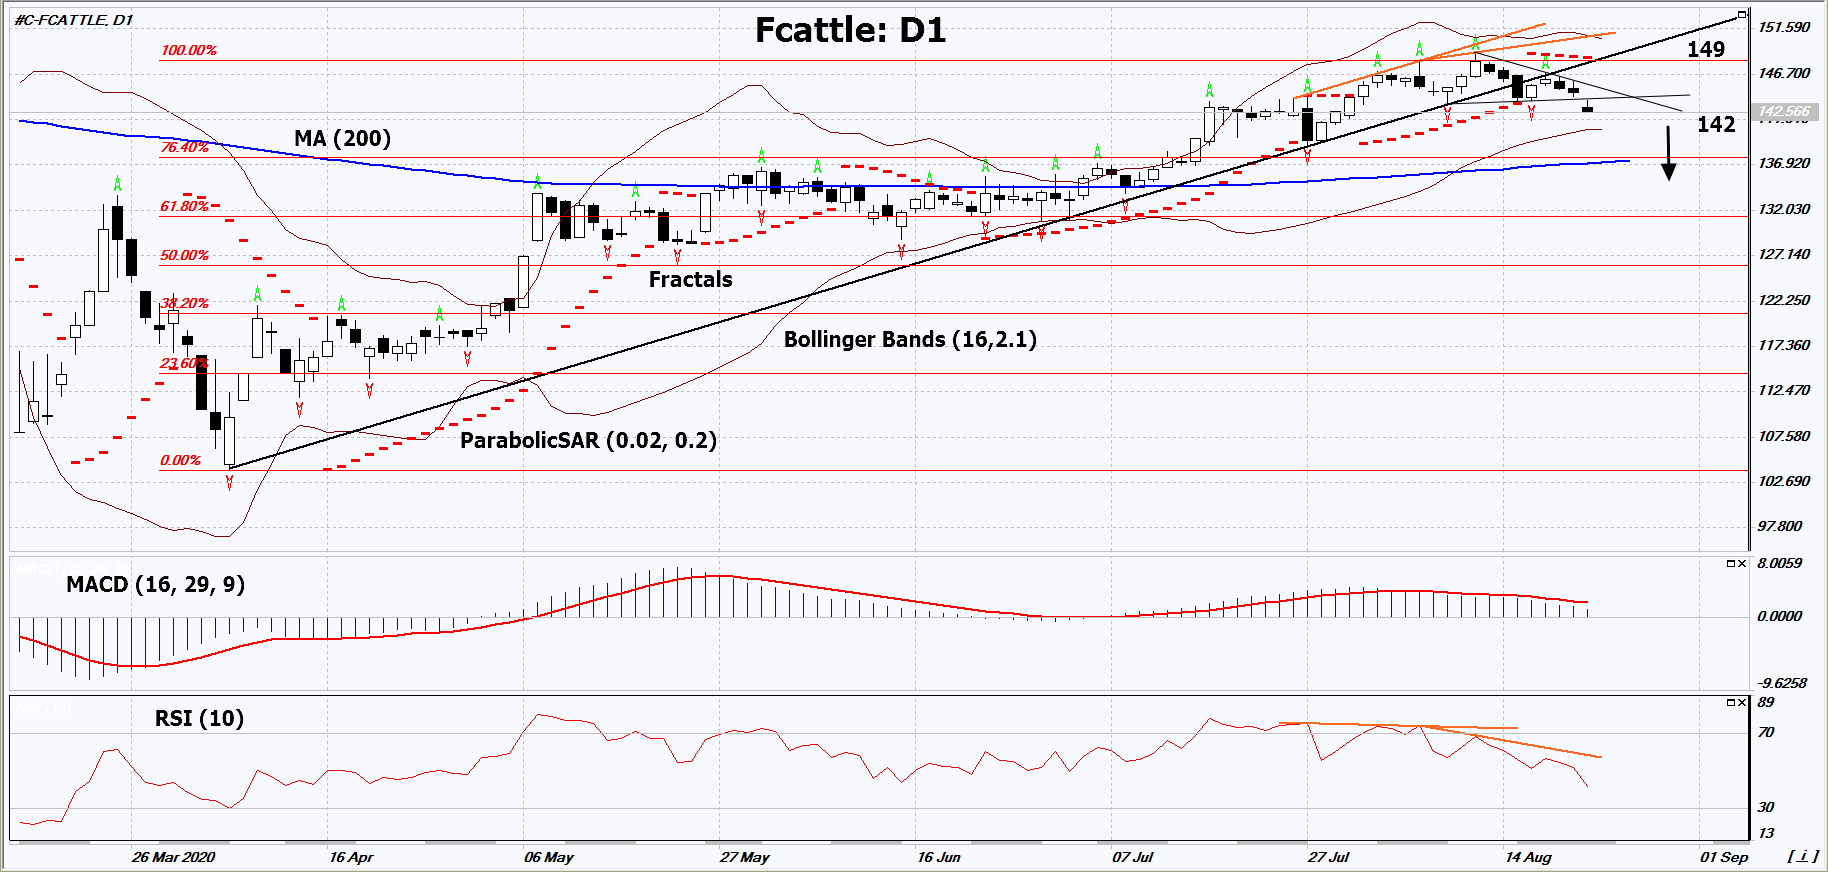
से नीचे 142
Sell Stop
उपरोक्त 149
Stop Loss
| संकेतक | संकेत |
| RSI | बेचना |
| MACD | बेचना |
| MA(200) | तटस्थ |
| Fractals | बेचना |
| Parabolic SAR | बेचना |
| Bollinger Bands | तटस्थ |
फीडर पशु चार्ट विश्लेषण
फीडर पशु तकनीकी विश्लेषण
On the daily timeframe, Fcattle: D1 is correcting down from its 10-month high. It got out of the growing trend. A number of technical analysis indicators generated signals for further decline. We do not rule out a bearish move if Fcattle falls below its last minimum: 142. This level can be used as an entry point. We can set a stop loss above the last upper fractal and Parabolic signal: 149. After opening a pending order, we move the stop loss following the Bollinger and Parabolic signals to the next fractal maximum. Thus, we change the potential profit/loss ratio in our favor. After the transaction, the most risk-averse traders can switch to the four-hour chart and set a stop loss, moving it in the direction of the trend. If the price meets the stop loss (149) without activating the order (142), it is recommended to delete the order: some internal changes in the market have not been taken into account.
मौलिक विश्लेषण कमोडिटीज - फीडर पशु
The United States Department of Agriculture (USDA) published its monthly Cattle on Feed report. Will Fcattle quotations go down?
The USDA report notes that the number of cattle placed in feedlots during July 2020 increased by 11% compared to July 2019 and reached 1.89 million. At the same time, the total livestock, which on August 1, 2020, was in feedlots, increased by 1% compared to last year and amounted to 11.3 million heads. This is the highest amount since the USDA started publishing statistics in 1996. It can be assumed that the American beef supply has practically recovered after the quarantine due to the coronavirus. At the same time, according to the USDA, since the beginning of 2020, the cattle slaughter is 1.06 million less than last year as of the current date. In theory, this may indicate that demand has not fully recovered yet.
Explore our
Trading Conditions
- Spreads from 0.0 pip
- 30,000+ Trading Instruments
- Stop Out Level - Only 10%
Ready to Trade?
Open Account ध्यान दें:
यह ओवरव्यू एक जानकारीपूर्ण और ट्यूटोरियल चरित्र है और मुफ्त में प्रकाशित किया जाता है. सभी डेटा, ओवरव्यू में शामिल, सार्वजनिक स्रोतों से प्राप्त कर रहे हैं, कम या ज्यादा विश्वसनीय रूप में मान्यता प्राप्त. अतिरिक्त, संकेत दिया जानकारी पूर्ण और सटीक है कि कोई गारंटी नहीं है. ओवरव्यू अद्यतन नहीं हैं . प्रत्येक ओवरव्यू में पूरी जानकारी, भी शामिल राय, इंडीकेटर्स , चार्ट और कुछ और, परिचय उद्देश्यों के लिए ही प्रदान की जाती है और वित्तीय सलाह या सिफारिश नहीं है. पूरे पाठ और उसके किसी भी हिस्से, और साथ हीचार्ट किसी भी संपत्ति के साथ एक सौदा करने के लिए एक प्रस्ताव के रूप में नहीं माना जा सकता है . IFC मार्केट्स और किसी भी परिस्थिति में अपने कर्मचारियों को किसी और के द्वारा की गई किसी कार्रवाई के दौरान लिए उत्तरदायी नहीं हैं या ओवरव्यू पढ़ने के बाद.

