- एनालिटिक्स
- टेक्निकल एनालिसिस
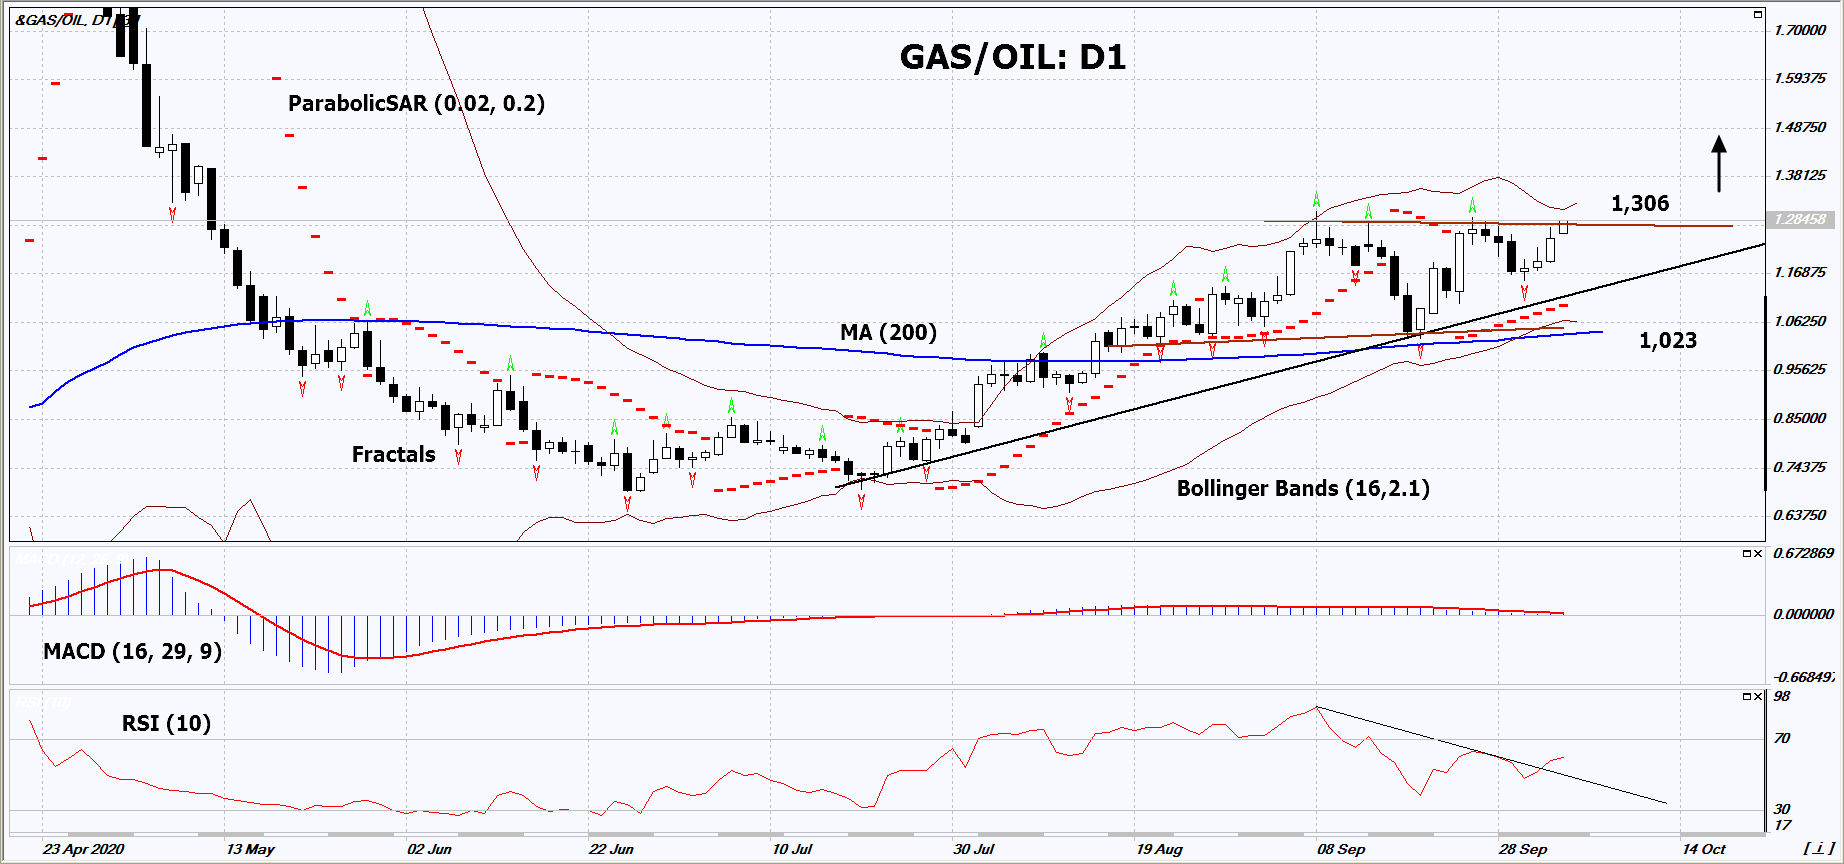
तकनीकी विश्लेषण - ट्रेडिंग: 2020-10-06
तकनीकी विश्लेषण सारांश
उपरोक्त 1.306
Buy Stop
से नीचे 1.023
Stop Loss
| संकेतक | संकेत |
| RSI | तटस्थ |
| MACD | तटस्थ |
| MA(200) | तटस्थ |
| Fractals | तटस्थ |
| Parabolic SAR | खरीदें |
| Bollinger Bands | खरीदें |
चार्ट विश्लेषण
तकनीकी विश्लेषण
On the daily timeframe, GAS/OIL: D1 approached the upper border of the neutral range. It must be broken upward before opening a position. A number of technical analysis indicators formed signals for further growth. We do not exclude a bullish movement if GAS/OIL rises above the last 3 upper fractals: 1.306. This level can be used as an entry point. We can set a stop loss below the Parabolic signal, the lower Bollinger band, the 200-day moving average line and the last 2 lower fractals: 1.023. After opening a pending order, we move the stop loss to the next fractal low following the Bollinger and Parabolic signals. Thus, we change the potential profit/loss ratio in our favor. After the transaction the most risk-averse can switch to the four-hour chart and set a stop-loss, moving it in the direction of the bias. If the price meets the stop loss (1.023) without activating the order (1.306), it is recommended to delete the order: some internal changes in the market have not been taken into account.
मौलिक विश्लेषण PCI -
In this review, we propose to consider the &GAS/OIL Personal Composite Instrument (PCI). It reflects the dynamics of changes in the American natural gas prices over West Texas Intermediate (WTI) - the American light crude oil. Will the GAS/OIL quotes grow ?
Their upward move means that natural gas is in higher demand than oil. This PCI showed strong growth in mid-April of this year, during the 1st wave of coronavirus. Later, it corrected downwards. A similar surge is possible if there is a second wave of coronavirus. In this case, the demand for oil and motor fuel may decrease as lockdowns resume and traffic flows decline. In theory, the demand for gas can be reduced to a lesser extent, since it is used for winter heating and power generation. According to the U.S. Energy Information Administration (EIA), US oil reserves are now 12.4% higher than the 5-year average, and natural gas reserves are about the same - higher by 12.1%. Both types of raw materials are rising in price against the backdrop of Hurricane Delta in the Gulf of Mexico, which interferes with the operation of oil and gas production platforms. The growth of liquefied gas (LNG) exports by more than 20% compared to last year is helping to increase natural gas prices.
Explore our
Trading Conditions
- Spreads from 0.0 pip
- 30,000+ Trading Instruments
- Stop Out Level - Only 10%
Ready to Trade?
Open Account ध्यान दें:
यह ओवरव्यू एक जानकारीपूर्ण और ट्यूटोरियल चरित्र है और मुफ्त में प्रकाशित किया जाता है. सभी डेटा, ओवरव्यू में शामिल, सार्वजनिक स्रोतों से प्राप्त कर रहे हैं, कम या ज्यादा विश्वसनीय रूप में मान्यता प्राप्त. अतिरिक्त, संकेत दिया जानकारी पूर्ण और सटीक है कि कोई गारंटी नहीं है. ओवरव्यू अद्यतन नहीं हैं . प्रत्येक ओवरव्यू में पूरी जानकारी, भी शामिल राय, इंडीकेटर्स , चार्ट और कुछ और, परिचय उद्देश्यों के लिए ही प्रदान की जाती है और वित्तीय सलाह या सिफारिश नहीं है. पूरे पाठ और उसके किसी भी हिस्से, और साथ हीचार्ट किसी भी संपत्ति के साथ एक सौदा करने के लिए एक प्रस्ताव के रूप में नहीं माना जा सकता है . IFC मार्केट्स और किसी भी परिस्थिति में अपने कर्मचारियों को किसी और के द्वारा की गई किसी कार्रवाई के दौरान लिए उत्तरदायी नहीं हैं या ओवरव्यू पढ़ने के बाद.

