- एनालिटिक्स
- टेक्निकल एनालिसिस
Toyota Motor तकनीकी विश्लेषण - Toyota Motor ट्रेडिंग: 2024-04-25
Toyota Motor तकनीकी विश्लेषण सारांश
उपरोक्त 233.71
Buy Stop
से नीचे 228.09
Stop Loss
| संकेतक | संकेत |
| RSI | तटस्थ |
| MACD | खरीदें |
| Donchian Channel | खरीदें |
| MA(200) | खरीदें |
| Fractals | खरीदें |
| Parabolic SAR | खरीदें |
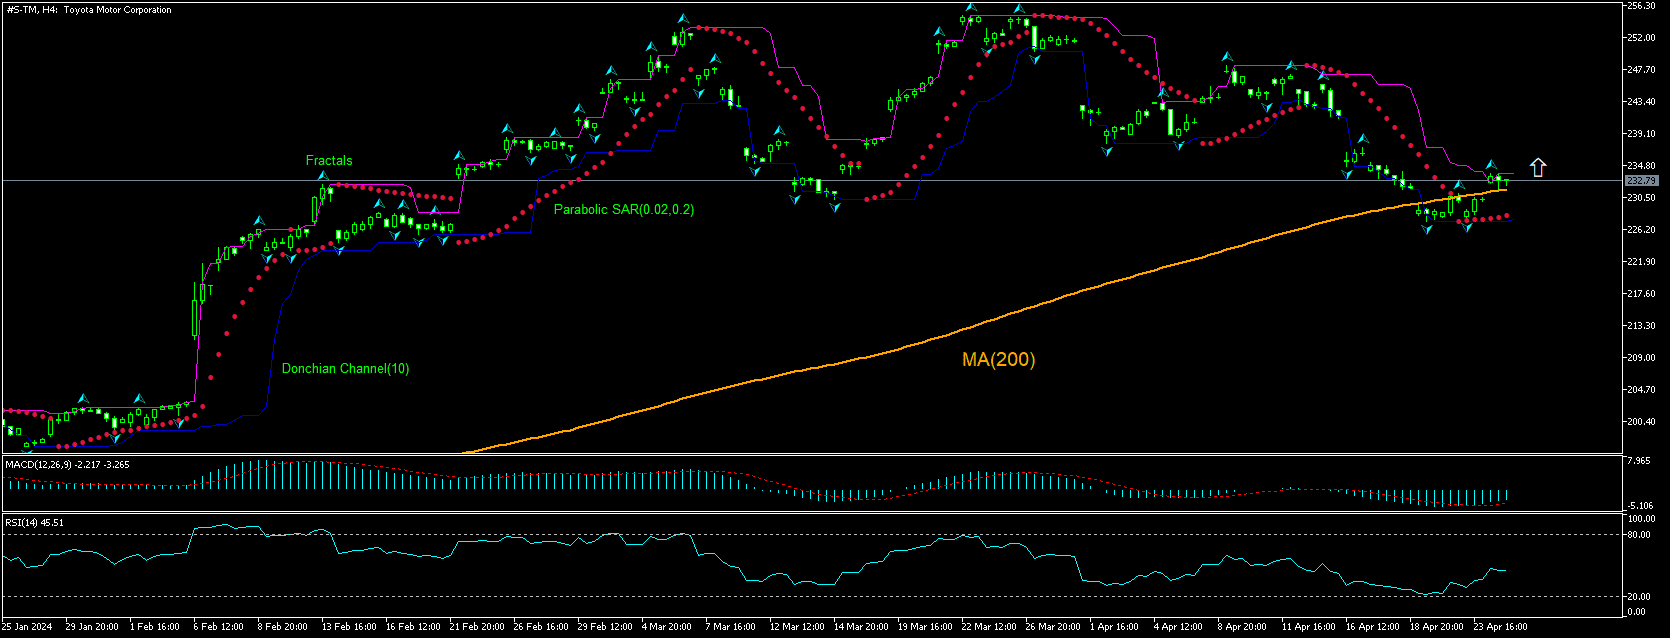
Toyota Motor चार्ट विश्लेषण
Toyota Motor तकनीकी विश्लेषण
The technical analysis of the Toyota Motor stock price chart on 4-hour timeframe shows #S-TM, H4 is testing the 200-period moving average MA(200) after returning back above it. We believe the bullish momentum will continue after the price breaches above the upper bound of Donchian channel at 233.71. This level can be used as an entry point for placing a pending order to buy. The stop loss can be placed below 228.09. After placing the order, the stop loss is to be moved every day to the next fractal low, following Parabolic indicator signals. Thus, we are changing the expected profit/loss ratio to the breakeven point. If the price meets the stop loss level (228.09) without reaching the order (233.71), we recommend cancelling the order: the market has undergone internal changes which were not taken into account.
मौलिक विश्लेषण शेयरों - Toyota Motor
Toyota Motor said its global production hit record high in the year ended in March. Will the Toyota Motor stock price continue rebounding?
Toyota Motor Corporation said today it set a global annual record both in sales and production in the business year ended in March. Toyota said its parent-only production reached 9.97 million vehicles globally in the 12 months through March 31, rising 9.2% over the year. Global sales for the 12 months ended March rose to 10.31 million vehicles, exceeding the 10 million mark for the first time and rising 7.3% over the prior year. But the world's biggest automaker by volume recorded sales and production falls in March due to strong competition in China, the world's largest auto market. Higher sales and output are bullish for a company’s stock price.
ध्यान दें:
यह ओवरव्यू एक जानकारीपूर्ण और ट्यूटोरियल चरित्र है और मुफ्त में प्रकाशित किया जाता है. सभी डेटा, ओवरव्यू में शामिल, सार्वजनिक स्रोतों से प्राप्त कर रहे हैं, कम या ज्यादा विश्वसनीय रूप में मान्यता प्राप्त. अतिरिक्त, संकेत दिया जानकारी पूर्ण और सटीक है कि कोई गारंटी नहीं है. ओवरव्यू अद्यतन नहीं हैं . प्रत्येक ओवरव्यू में पूरी जानकारी, भी शामिल राय, इंडीकेटर्स , चार्ट और कुछ और, परिचय उद्देश्यों के लिए ही प्रदान की जाती है और वित्तीय सलाह या सिफारिश नहीं है. पूरे पाठ और उसके किसी भी हिस्से, और साथ हीचार्ट किसी भी संपत्ति के साथ एक सौदा करने के लिए एक प्रस्ताव के रूप में नहीं माना जा सकता है . IFC मार्केट्स और किसी भी परिस्थिति में अपने कर्मचारियों को किसी और के द्वारा की गई किसी कार्रवाई के दौरान लिए उत्तरदायी नहीं हैं या ओवरव्यू पढ़ने के बाद.


