- एनालिटिक्स
- टेक्निकल एनालिसिस
USD/JPY तकनीकी विश्लेषण - USD/JPY ट्रेडिंग: 2025-05-21
USD/JPY तकनीकी विश्लेषण सारांश
से नीचे 143.23
Sell Stop
उपरोक्त 145.12
Stop Loss
| संकेतक | संकेत |
| RSI | खरीदें |
| MACD | बेचना |
| Donchian Channel | बेचना |
| MA(200) | खरीदें |
| Fractals | बेचना |
| Parabolic SAR | बेचना |
USD/JPY चार्ट विश्लेषण
USD/JPY तकनीकी विश्लेषण
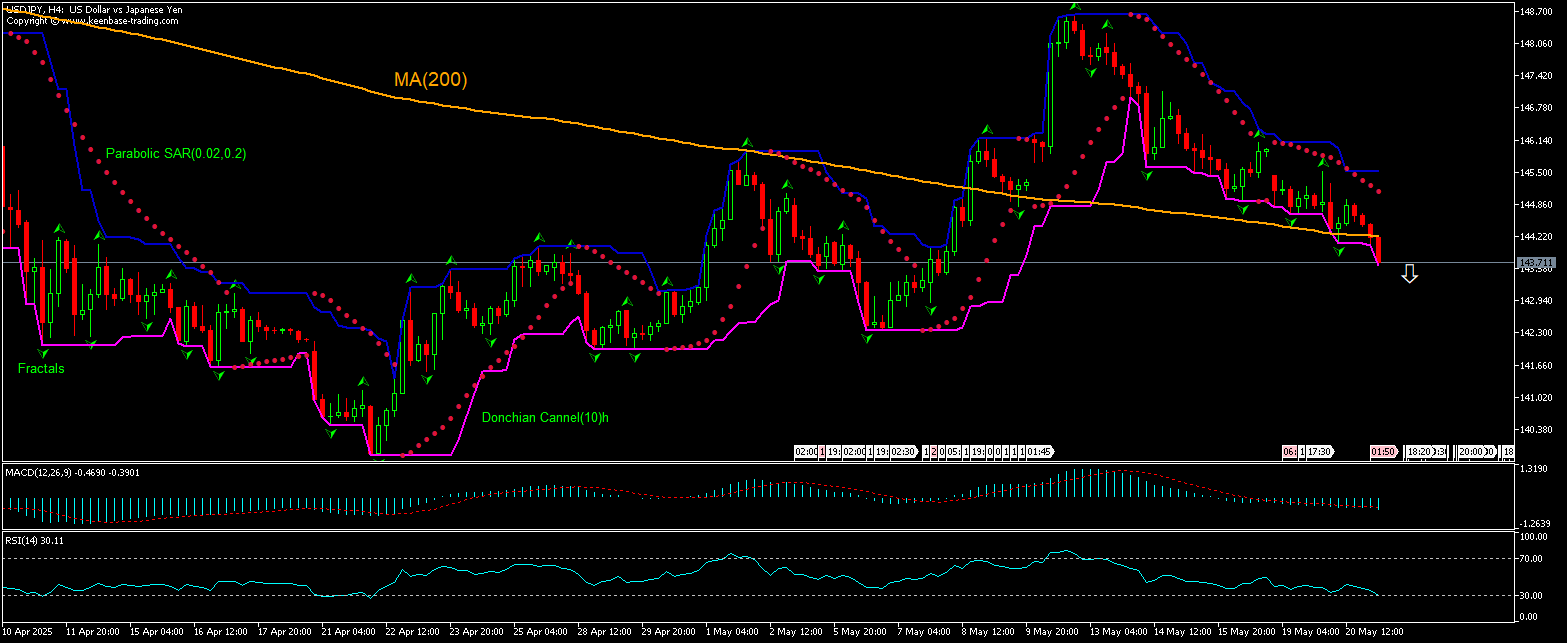
The technical analysis of the USDJPY price chart on 4-hour timeframe shows USDJPY,H4 has breached below the 200-period moving average MA(200) as it is retreating after hitting six-week high nine days ago. RSI indicator is about to breach into oversold zone. We believe the bearish momentum will continue after the price breaches below the lower bound of the Donchian channel at 143.23. A level below this can be used as an entry point for placing a pending order to sell. The stop loss can be placed above 145.12. After placing the order, the stop loss is to be moved to the next fractal high indicator, following Parabolic signals. Thus, we are changing the expected profit/loss ratio to the breakeven point. If the price meets the stop loss level without reaching the order, we recommend cancelling the order: the market has undergone internal changes which were not taken into account.
मौलिक विश्लेषण FOREX - USD/JPY
Japan’s trade deficit narrowed in April. Will the USDJPY price retreat continue?
Trade deficit narrowed in Japan: the Ministry of Finance reported the trade deficit narrowed to 115.85 billion yen in April from 504.69 billion in March, when a recovery to 271.1 billion yen surplus was forecast. Japan’s exports advanced at a slower 2% over year rate in April, in line with forecasts. This was the seventh straight month of growth albeit at the slowest pace in the that period in the aftermath of US tariffs. Shipments to the US fell 1.8%, the first drop in four months, on falling demand for automobiles, steel and ships. At the same time, total Japanese imports shrank 2.2% from a year ago but below a forecast of 4.5% decline. Narrower Japanese trade deficit is bullish for yen and bearish for the USDJPY pair. At the same time, data showed Japan’s real gross domestic product contracted at an annualized 0.7% rate in the first quarter this year, which is bullish for USDJPY.
Explore our
Trading Conditions
- Spreads from 0.0 pip
- 30,000+ Trading Instruments
- Instant Execution
Ready to Trade?
Open Account ध्यान दें:
यह ओवरव्यू एक जानकारीपूर्ण और ट्यूटोरियल चरित्र है और मुफ्त में प्रकाशित किया जाता है. सभी डेटा, ओवरव्यू में शामिल, सार्वजनिक स्रोतों से प्राप्त कर रहे हैं, कम या ज्यादा विश्वसनीय रूप में मान्यता प्राप्त. अतिरिक्त, संकेत दिया जानकारी पूर्ण और सटीक है कि कोई गारंटी नहीं है. ओवरव्यू अद्यतन नहीं हैं . प्रत्येक ओवरव्यू में पूरी जानकारी, भी शामिल राय, इंडीकेटर्स , चार्ट और कुछ और, परिचय उद्देश्यों के लिए ही प्रदान की जाती है और वित्तीय सलाह या सिफारिश नहीं है. पूरे पाठ और उसके किसी भी हिस्से, और साथ हीचार्ट किसी भी संपत्ति के साथ एक सौदा करने के लिए एक प्रस्ताव के रूप में नहीं माना जा सकता है . IFC मार्केट्स और किसी भी परिस्थिति में अपने कर्मचारियों को किसी और के द्वारा की गई किसी कार्रवाई के दौरान लिए उत्तरदायी नहीं हैं या ओवरव्यू पढ़ने के बाद.

