- एनालिटिक्स
- टेक्निकल एनालिसिस
USD/SGD तकनीकी विश्लेषण - USD/SGD ट्रेडिंग: 2021-01-20
USD/SGD तकनीकी विश्लेषण सारांश
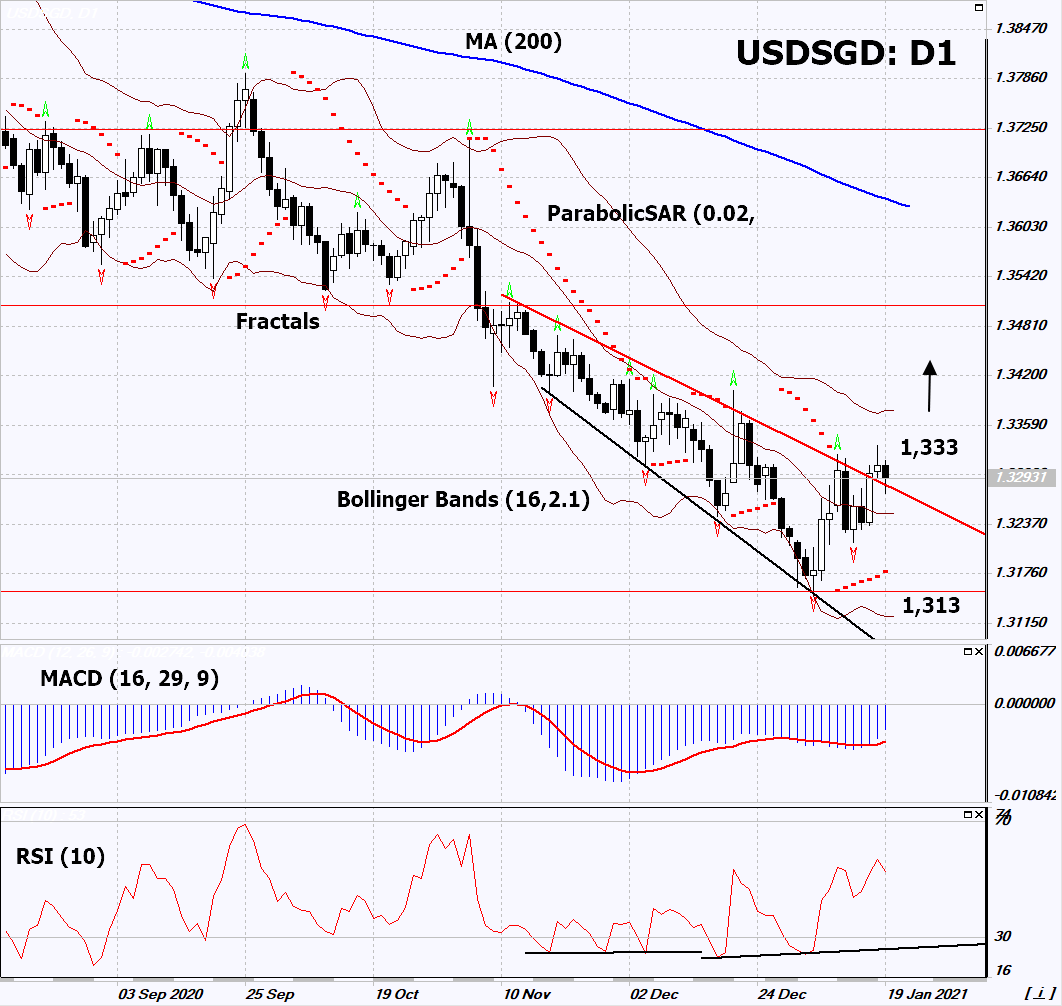
उपरोक्त 1,333
Buy Stop
से नीचे 1,313
Stop Loss
| संकेतक | संकेत |
| RSI | खरीदें |
| MACD | खरीदें |
| MA(200) | तटस्थ |
| Fractals | तटस्थ |
| Parabolic SAR | खरीदें |
| Bollinger Bands | तटस्थ |
USD/SGD चार्ट विश्लेषण
USD/SGD तकनीकी विश्लेषण
On the daily timeframe, USDSGD: D1 broke through the downtrend resistance line. A number of technical analysis indicators formed signals for further growth. We do not rule out a bullish move if USDSGD rises above the last maximum and the last high fractal: 1.333. This level can be used as an entry point. We can place a stop loss below the minimum since April 2018, the last lower fractal, the lower Bollinger band and the Parabolic signal: 1.313. After opening a pending order, we move the stop loss to the next fractal low following the Bollinger and Parabolic signals. Thus, we change the potential profit/loss ratio in our favor. After the transaction, the most risk-averse traders can switch to the four-hour chart and set a stop loss, moving it in the direction of the bias. If the price meets the stop loss (1.313) without activating the order (1.333), it is recommended to delete the order: the market sustained internal changes that have not been taken into account.
मौलिक विश्लेषण FOREX - USD/SGD
Singapore's export growth may have been driven by a weak base effect. Will the USDSGD quotes move up?
The upward move signifies the weakening of the Singapore dollar against the greenback. In December 2020, Singapore's Non-Oil Exports rose by +6.8% yoy after falling by -5% in November and -3.1% in October. According to Moody’s agency, part of the December growth was due to a low base amid trade wars and a downturn in electronics sales. Recall that at the end of 2020, Singapore's GDP decreased by 6% (according to Moody’s). The decrease in the current account was 20%. The government debt rose to 130% of GDP. December inflation data, which will be released on 25 January, may affect the dynamics of the Singapore dollar. The projected deflation is -0.2 yoy. The Monetary Authority of Singapore (Central Bank of Singapore) rate is 0.06%.
Explore our
Trading Conditions
- Spreads from 0.0 pip
- 30,000+ Trading Instruments
- Stop Out Level - Only 10%
Ready to Trade?
Open Account ध्यान दें:
यह ओवरव्यू एक जानकारीपूर्ण और ट्यूटोरियल चरित्र है और मुफ्त में प्रकाशित किया जाता है. सभी डेटा, ओवरव्यू में शामिल, सार्वजनिक स्रोतों से प्राप्त कर रहे हैं, कम या ज्यादा विश्वसनीय रूप में मान्यता प्राप्त. अतिरिक्त, संकेत दिया जानकारी पूर्ण और सटीक है कि कोई गारंटी नहीं है. ओवरव्यू अद्यतन नहीं हैं . प्रत्येक ओवरव्यू में पूरी जानकारी, भी शामिल राय, इंडीकेटर्स , चार्ट और कुछ और, परिचय उद्देश्यों के लिए ही प्रदान की जाती है और वित्तीय सलाह या सिफारिश नहीं है. पूरे पाठ और उसके किसी भी हिस्से, और साथ हीचार्ट किसी भी संपत्ति के साथ एक सौदा करने के लिए एक प्रस्ताव के रूप में नहीं माना जा सकता है . IFC मार्केट्स और किसी भी परिस्थिति में अपने कर्मचारियों को किसी और के द्वारा की गई किसी कार्रवाई के दौरान लिए उत्तरदायी नहीं हैं या ओवरव्यू पढ़ने के बाद.

