- एनालिटिक्स
- टेक्निकल एनालिसिस
Bank of America तकनीकी विश्लेषण - Bank of America ट्रेडिंग: 2024-04-17
Bank of America तकनीकी विश्लेषण सारांश
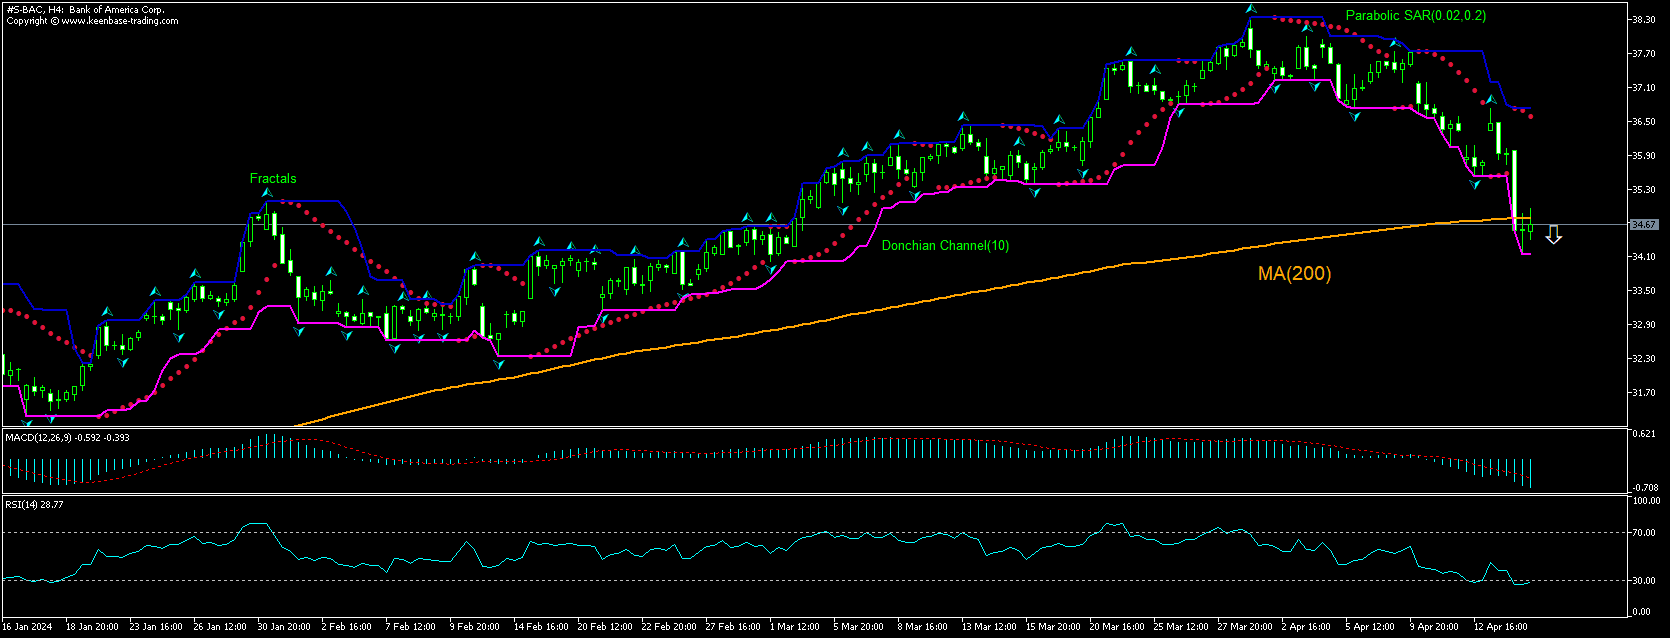
से नीचे 34.14
Sell Stop
उपरोक्त 36.73
Stop Loss
| संकेतक | संकेत |
| RSI | खरीदें |
| MACD | बेचना |
| Donchian Channel | तटस्थ |
| MA(200) | बेचना |
| Fractals | बेचना |
| Parabolic SAR | बेचना |
Bank of America चार्ट विश्लेषण
Bank of America तकनीकी विश्लेषण
The technical analysis of the Bank of America stock price chart on 4-hour timeframe shows #S-BAC,H4 has fallen under the 200-period moving average MA(200) which is rising itself. The RSI is about to leave the oversold zone. We believe the bearish momentum will continue after the price breaches below the lower boundary of Donchian channel at 34.14. This level can be used as an entry point for placing a pending order to sell. The stop loss can be placed above the fractal high at 36.73. After placing the order, the stop loss is to be moved every day to the next fractal high, following Parabolic indicator signals. Thus, we are changing the expected profit/loss ratio to the breakeven point. If the price meets the stop loss level (36.73) without reaching the order (34.14), we recommend cancelling the order: the market has undergone internal changes which were not taken into account.
मौलिक विश्लेषण शेयरों - Bank of America
Bank of America stock fell after the company reported better than expected revenue and earnings. Will the Bank of America stock price continue retreating?
Bank of America beat first quarter revenue and earnings estimates yesterday but the stock ended 3.5% lower for the day. The bank reported revenue of $25.82 billion, exceeding the Wall Street consensus estimate of $25.46 billion. However the revenue was down 2% year over year as higher investment banking and trading revenues were unable to offset lower net interest income. Bank of America reported a 18% drop in first-quarter profit as the bank reported higher expenses and charge-offs of bad loans that exceeded expectations. Charge-offs for bad loans totaled $1.5 billion, up 26% from the final three months of 2023 and significantly above the $1.26 billion analysts had expected. The company attributed the higher-than-expected charge-off number to an increase in credit card issues, but stated that the number is flattening out. The bank stated that its unrealized losses on a $587 billion portfolio of bonds that are classified as held to maturity for accounting purposes widened by $11 billion to $109 billion on March 31 from $98 billion at year-end 2023. Bank of America has by far the largest bond losses in the banking industry.
ध्यान दें:
यह ओवरव्यू एक जानकारीपूर्ण और ट्यूटोरियल चरित्र है और मुफ्त में प्रकाशित किया जाता है. सभी डेटा, ओवरव्यू में शामिल, सार्वजनिक स्रोतों से प्राप्त कर रहे हैं, कम या ज्यादा विश्वसनीय रूप में मान्यता प्राप्त. अतिरिक्त, संकेत दिया जानकारी पूर्ण और सटीक है कि कोई गारंटी नहीं है. ओवरव्यू अद्यतन नहीं हैं . प्रत्येक ओवरव्यू में पूरी जानकारी, भी शामिल राय, इंडीकेटर्स , चार्ट और कुछ और, परिचय उद्देश्यों के लिए ही प्रदान की जाती है और वित्तीय सलाह या सिफारिश नहीं है. पूरे पाठ और उसके किसी भी हिस्से, और साथ हीचार्ट किसी भी संपत्ति के साथ एक सौदा करने के लिए एक प्रस्ताव के रूप में नहीं माना जा सकता है . IFC मार्केट्स और किसी भी परिस्थिति में अपने कर्मचारियों को किसी और के द्वारा की गई किसी कार्रवाई के दौरान लिए उत्तरदायी नहीं हैं या ओवरव्यू पढ़ने के बाद.


