- एनालिटिक्स
- टेक्निकल एनालिसिस
स्टॉक इंडेक्स ऑफ़ जर्मनी तकनीकी विश्लेषण - स्टॉक इंडेक्स ऑफ़ जर्मनी ट्रेडिंग: 2020-08-20
जर्मनी के स्टॉक इंडेक्स (30) तकनीकी विश्लेषण सारांश
उपरोक्त 13098.13
Buy Stop
से नीचे 12514.45
Stop Loss
| संकेतक | संकेत |
| Stochastic | तटस्थ |
| MACD | तटस्थ |
| Donchian Channel | तटस्थ |
| MA(200) | खरीदें |
| Fractals | खरीदें |
| Parabolic SAR | खरीदें |
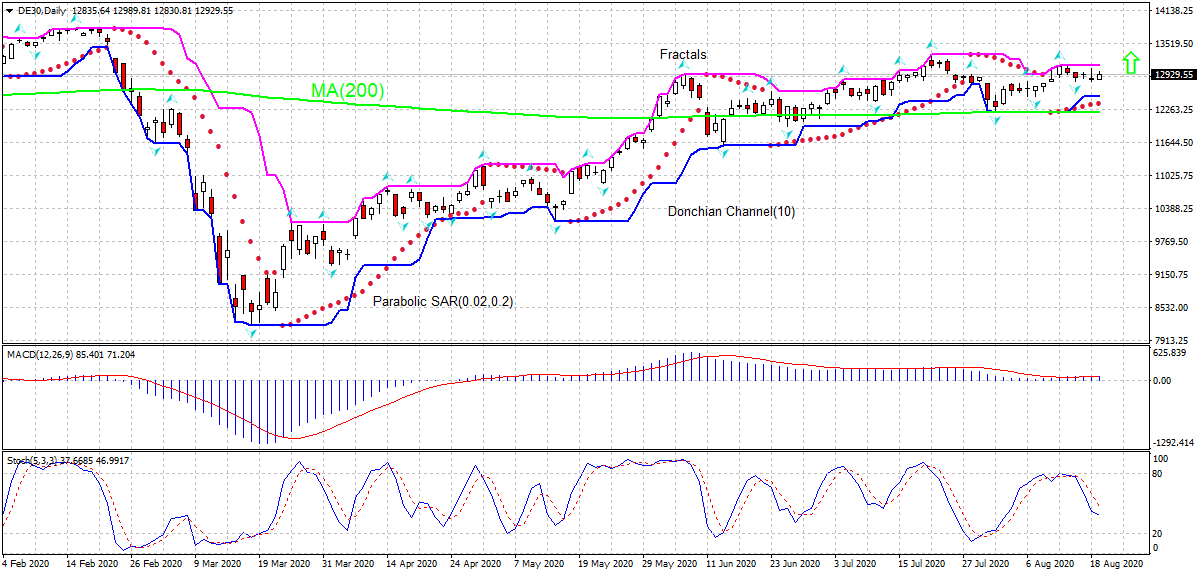
जर्मनी के स्टॉक इंडेक्स (30) चार्ट विश्लेषण
जर्मनी के स्टॉक इंडेक्स (30) तकनीकी विश्लेषण
On the daily timeframe the DE30: D1 is rising above the 200-day moving average MA(200) which has leveled off. We believe the bullish momentum will continue after the price breaches above the upper boundary of Donchian channel at 13098.13. A level above this can be used as an entry point for placing a pending order to buy. The stop loss can be placed below 12514.45. After placing the order, the stop loss is to be moved every day to the next fractal low, following Parabolic signals. Thus, we are changing the expected profit/loss ratio to the breakeven point. If the price meets the stop loss level (12514.45) without reaching the order (13098.13), we recommend cancelling the order: the market has undergone internal changes which were not taken into account
मौलिक विश्लेषण इंडिसस - जर्मनी के स्टॉक इंडेक्स (30)
Germany’s economic reports were positive recently. Will the DE30 rebound continue?
Germany’s economic data in the last couple of weeks were positive after the Q2 GDP report. While construction sector contraction continued in July, the retail sales growth of 5.9% over year was above an expected 2.6% increase. And factory orders jumped at higher pace than expected in June, manufacturing activities joined services sector expansion in July according to Markit’s final manufacturing and services PMIs reports, and construction sector contraction slowed as evidenced by construction PMI reading of 47.1 after 41.3 in June. Readings above 50.0 indicate industry expansion, below indicate contraction. At the same time current account surplus more than tripled to 22.4 billion euro in June from 7 billion in May. Improving data are bullish for DE30.
Explore our
Trading Conditions
- Spreads from 0.0 pip
- 30,000+ Trading Instruments
- Instant Execution
Ready to Trade?
Open Account ध्यान दें:
यह ओवरव्यू एक जानकारीपूर्ण और ट्यूटोरियल चरित्र है और मुफ्त में प्रकाशित किया जाता है. सभी डेटा, ओवरव्यू में शामिल, सार्वजनिक स्रोतों से प्राप्त कर रहे हैं, कम या ज्यादा विश्वसनीय रूप में मान्यता प्राप्त. अतिरिक्त, संकेत दिया जानकारी पूर्ण और सटीक है कि कोई गारंटी नहीं है. ओवरव्यू अद्यतन नहीं हैं . प्रत्येक ओवरव्यू में पूरी जानकारी, भी शामिल राय, इंडीकेटर्स , चार्ट और कुछ और, परिचय उद्देश्यों के लिए ही प्रदान की जाती है और वित्तीय सलाह या सिफारिश नहीं है. पूरे पाठ और उसके किसी भी हिस्से, और साथ हीचार्ट किसी भी संपत्ति के साथ एक सौदा करने के लिए एक प्रस्ताव के रूप में नहीं माना जा सकता है . IFC मार्केट्स और किसी भी परिस्थिति में अपने कर्मचारियों को किसी और के द्वारा की गई किसी कार्रवाई के दौरान लिए उत्तरदायी नहीं हैं या ओवरव्यू पढ़ने के बाद.

