- एनालिटिक्स
- शीर्ष फायदे/हारे
Top gainers and losers: The US Dollar and Stock-Based Personal Composite Instruments
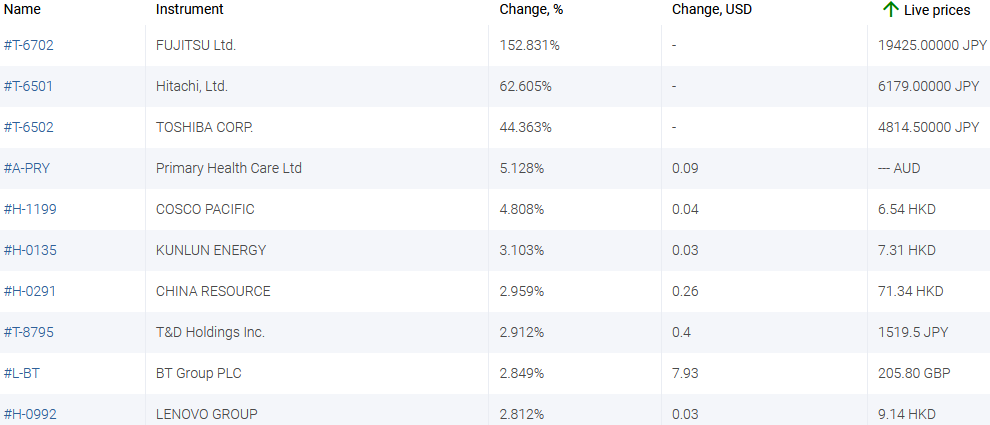
 Top gainers - global market
Over the past 7 days, the US dollar index has grown strongly. U.S. At the meeting on June 16, the Federal Reserve kept the current rate of 0.25% and the monthly volume of bond buybacks of $ 120 billion.However, at the same time it was announced that an increase in the rate by another 0.25% could occur in 2023, a year earlier than it was expected before. ... This message contributed to the strengthening of the American currency. At the same time, some stocks and personal stock-based composite instruments were down as a result of this. The Japanese yen strengthened ahead of the next meeting of the Bank of Japan (BoJ) on June 18 and the publication of inflation data for May.
1.Fujitsu Limited, +152,8% – Japanese manufacturer of electronics, computer hardware and software
2. Hitachi Ltd, +62,6% – Japanese manufacturer of electronics, computer equipment, industrial equipment, LCD displays, household and medical equipment
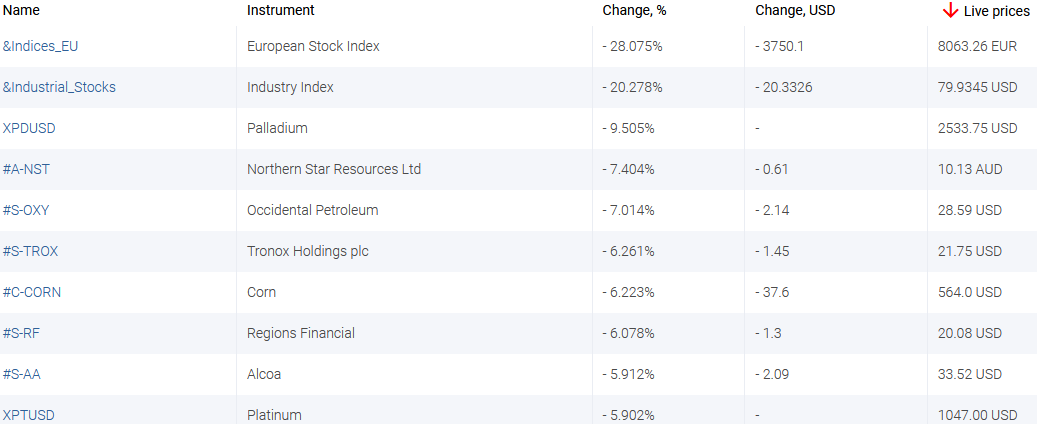
 Top losers - global market
1. &Indices_EU – personal composite instrument
2. &Industrial_Stocks – personal composite instrument.
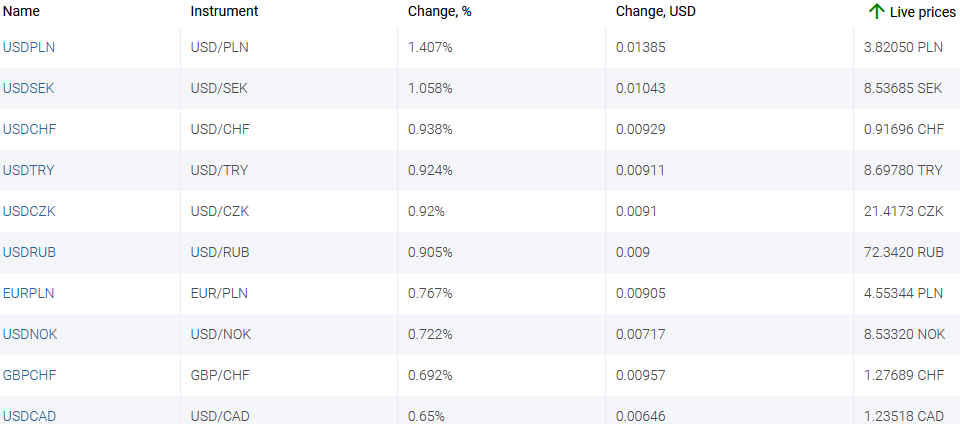
Top gainers - foreign exchange market (Forex)
1. USDPLN, USDSEK, USDCHF - the growth on these charts means the strengthening of the US dollar against the Polish zloty, the Swedish krona and the Swiss franc.
2. USDTRY, USDCZK - the growth on these charts means weakening of the Turkish lira and the Czech koruna against the US dollar.
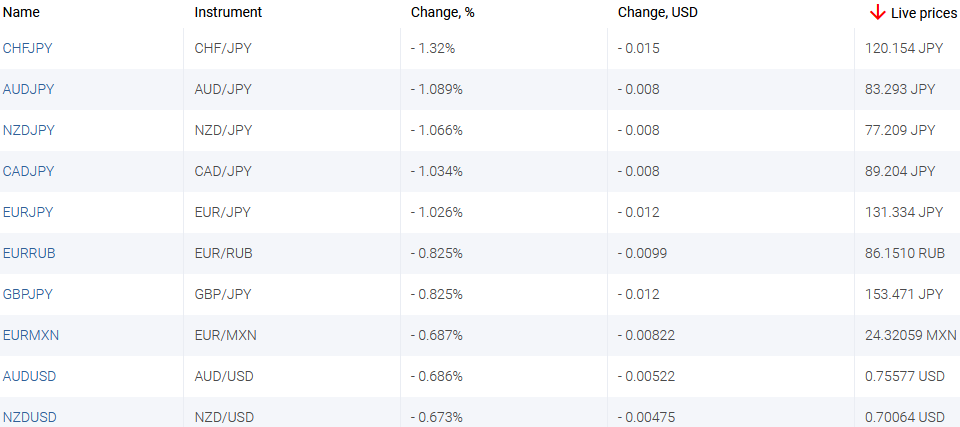
Top losers - foreign exchange market (Forex)
1. CHFJPY, AUDJPY - the drop in these charts means weakening of the Swiss franc and the Australian dollar against the Japanese yen.
2. NZDJPY, CADJPY - the decline in these charts means the strengthening of the Japanese yen against the New Zealand and Canadian dollars.
नया अनन्य विश्लेषणात्मक उपकरण
किसी भी तिथि सीमा - 1 दिन से 1 वर्ष तक
कोई ट्रेडिंग समूह - विदेशी मुद्रा, स्टॉक, सूचकांक, etc.
ध्यान दें:
यह ओवरव्यू एक जानकारीपूर्ण और ट्यूटोरियल चरित्र है और मुफ्त में प्रकाशित किया जाता है. सभी डेटा, ओवरव्यू में शामिल, सार्वजनिक स्रोतों से प्राप्त कर रहे हैं, कम या ज्यादा विश्वसनीय रूप में मान्यता प्राप्त. अतिरिक्त, संकेत दिया जानकारी पूर्ण और सटीक है कि कोई गारंटी नहीं है. ओवरव्यू अद्यतन नहीं हैं . प्रत्येक ओवरव्यू में पूरी जानकारी, भी शामिल राय, इंडीकेटर्स , चार्ट और कुछ और, परिचय उद्देश्यों के लिए ही प्रदान की जाती है और वित्तीय सलाह या सिफारिश नहीं है. पूरे पाठ और उसके किसी भी हिस्से, और साथ हीचार्ट किसी भी संपत्ति के साथ एक सौदा करने के लिए एक प्रस्ताव के रूप में नहीं माना जा सकता है . IFC मार्केट्स और किसी भी परिस्थिति में अपने कर्मचारियों को किसी और के द्वारा की गई किसी कार्रवाई के दौरान लिए उत्तरदायी नहीं हैं या ओवरव्यू पढ़ने के बाद.
- प्रमाण पत्र प्राप्त करेंe


पिछले टॉप गेनर्स और लूजर्स
Over the past 7 days, the American dollar has remained almost unchanged. According to the CME FedWatch tool, there is an 89% probability of the U.S. Federal Reserve raising interest rates at the meeting on July 26th. The Swiss franc has strengthened due to positive economic indicators such as Credit...
Over the past 7 days, the US dollar index has declined. As expected, the Federal Reserve (Fed) maintained its interest rate at 5.25% during the meeting on June 14. Now, investors are monitoring economic statistics and trying to forecast the change in the Fed's rate at the next meeting on July 26. The...
Over the past 7 days, the US dollar index has remained largely unchanged. It has been trading in a narrow range of 103.2-104.4 points for the 4th week in a row. Investors are awaiting the outcome of the Federal Reserve meeting on June 14. Tesla shares have risen due to the opening of new gigafactories...