- एनालिटिक्स
- टेक्निकल एनालिसिस
यूरो स्टोक्स 50 इंडेक्स तकनीकी विश्लेषण - यूरो स्टोक्स 50 इंडेक्स ट्रेडिंग: 2020-05-27
यूरो स्टोक्स 50 इंडेक्स तकनीकी विश्लेषण सारांश
उपरोक्त 3017.32
Buy Stop
से नीचे 2696.91
Stop Loss
| संकेतक | संकेत |
| RSI | तटस्थ |
| MACD | खरीदें |
| Donchian Channel | तटस्थ |
| MA(50) | खरीदें |
| Fractals | खरीदें |
| Parabolic SAR | खरीदें |
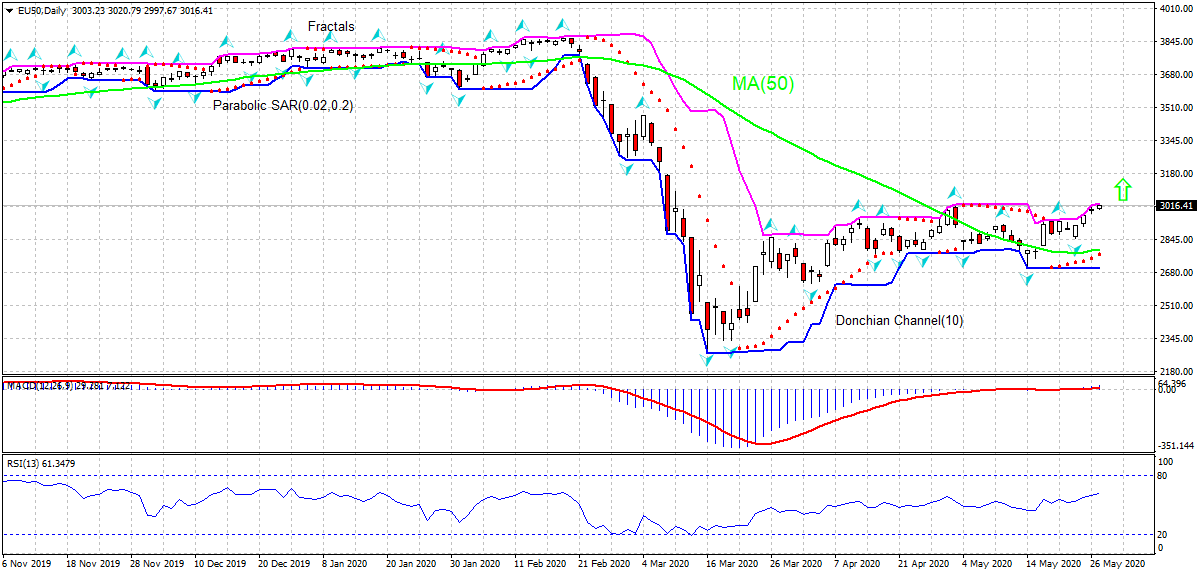
यूरो स्टोक्स 50 इंडेक्स चार्ट विश्लेषण
यूरो स्टोक्स 50 इंडेक्स तकनीकी विश्लेषण
On the daily timeframe EU50: D1 has rebounded above the 50-day moving average MA(50) which has stopped falling. We believe the bullish momentum will continue after the price breaches above the upper Donchian boundary at 3017.32. This level can be used as an entry point for placing a pending order to buy. The stop loss can be placed below 2696.91. After placing the pending order the stop loss is to be moved every day to the next fractal low, following Parabolic signals. Thus, we are changing the expected profit/loss ratio to the breakeven point. If the price meets the stop-loss level (3017.32) without reaching the order (2696.91) we recommend cancelling the order: the market sustains internal changes which were not taken into account.
मौलिक विश्लेषण इंडिसस - यूरो स्टोक्स 50 इंडेक्स
Euro-zone’s private business sector contraction slowed and investor sentiment improved. Will the EU50 rebound continue?
Euro area economic data in the last couple of weeks were not as bad as feared: contraction in private business sector activities slowed in May, investor morale improved further and consumer confidence improved more than expected. Markit’s Composite PMI for euro-zone went up to 30.5 in May 2020 from 13.6 in April when a reading of 25 was expected, according to preliminary estimate. Readings above 50 indicate activities expansion, below indicate contraction. The ZEW indicator of economic sentiment for the euro-zone rose from 25.2 in April to 46 in May, the highest reading since August 2015. And Eurostat survey results showed the consumer confidence index in euro-zone rose from the previous month's 11-year low -22 to -18.8 in May, when a reading of -24.0 was forecast. Readings above 0 indicate optimism, below indicate pessimism. Better data are bullish for EU50. Nevertheless, further deterioration of euro-zone’s economic performance is a downside risk: Eurostat is due to report the change in business confidence for euro area on Thursday, and a steeper than forecast deterioration is a downside risk for EU50.
ध्यान दें:
यह ओवरव्यू एक जानकारीपूर्ण और ट्यूटोरियल चरित्र है और मुफ्त में प्रकाशित किया जाता है. सभी डेटा, ओवरव्यू में शामिल, सार्वजनिक स्रोतों से प्राप्त कर रहे हैं, कम या ज्यादा विश्वसनीय रूप में मान्यता प्राप्त. अतिरिक्त, संकेत दिया जानकारी पूर्ण और सटीक है कि कोई गारंटी नहीं है. ओवरव्यू अद्यतन नहीं हैं . प्रत्येक ओवरव्यू में पूरी जानकारी, भी शामिल राय, इंडीकेटर्स , चार्ट और कुछ और, परिचय उद्देश्यों के लिए ही प्रदान की जाती है और वित्तीय सलाह या सिफारिश नहीं है. पूरे पाठ और उसके किसी भी हिस्से, और साथ हीचार्ट किसी भी संपत्ति के साथ एक सौदा करने के लिए एक प्रस्ताव के रूप में नहीं माना जा सकता है . IFC मार्केट्स और किसी भी परिस्थिति में अपने कर्मचारियों को किसी और के द्वारा की गई किसी कार्रवाई के दौरान लिए उत्तरदायी नहीं हैं या ओवरव्यू पढ़ने के बाद.


